
Jays vs Twins? Teams Top MMDBL's Pre-Season Rankings
Don't believe the hype, right? Never trust pre-season prognostications because they're typically wrong, correct?
Normally, yes. And perhaps this is also true in the case of the MMDBL's 2021 season. However, two teams, one in each league, appear to be odds-on favorites to find each other in the World Series later this fall. A lot can get in the way - injuries, trades, cold streaks, other teams' hot streaks - but the Toronto Blue Jays and Minnesota Twins enter Opening Day as the favorites to square off in the Fall Classic.
For our preseason analysis, we’re ranking teams according to a single empirical data point – Adjusted Total WAR. First, we total the hitting WAR of each player on a team’s roster, and the pitching WAR of each pitcher. The sum of those two numbers is the Total WAR. We then adjust those figures by removing any player or pitcher who produced a negative-WAR in 2020, under the presumption that they likely will not see the field in 2021. The resulting number is a team’s Adjusted Total WAR.
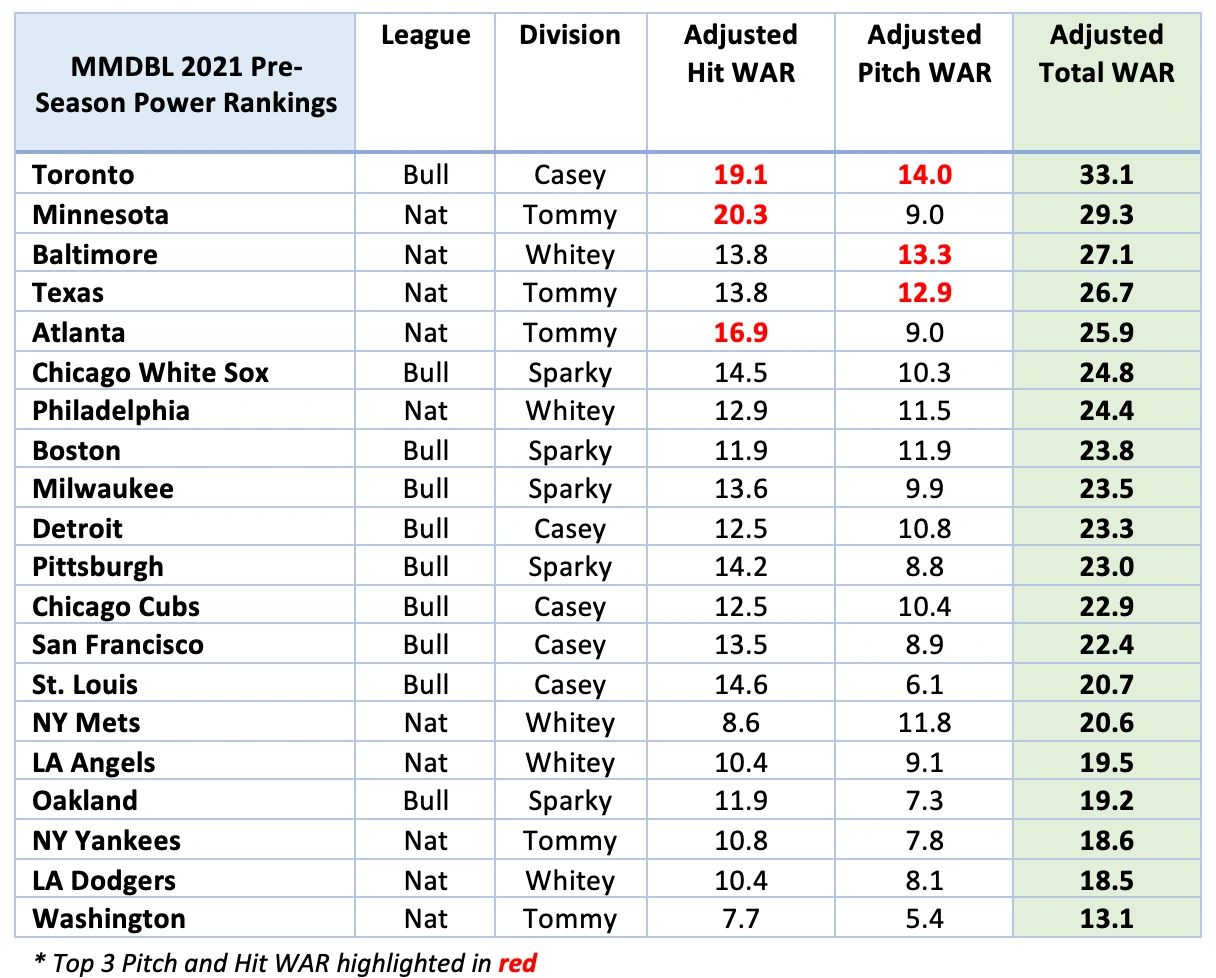
Toronto and Minnesota not only have the league's top two Adjusted Total WAR metrics, but Toronto is #1 in Adjusted Total Pitch WAR and Minnesota is #1 in Adjusted Total Hit WAR. The Blue Jays also boast strong hitting and enter the season #2 in Adjusted Total Hit WAR. If the Twins have any Achilles heel it might be in the run prevention department as they rank 12th in Adjusted Total Pitch WAR.
The Baltimore Orioles rank 3rd in the overall MMDBL pre-season rankings and offer a solid blend of hitting and pitching, ranking 7th and 2nd respectively in Adjusted Total Hit and Pitch WAR. Texas ranks 4th overall and is 7th and 3rd respectively in Adjusted Total Hit and Pitch WAR. Rounding out the top 5 in the pre-season overall rankings is Atlanta. The Braves rank 3rd in Adjusted Total Hit WAR but, like the Twins, fall to 12th in Adjusted Total Pitch WAR.
If you're keeping score, 4 of the top 5 in the MMDBL's pre-season rankings are from The Natural, with only the Blue Jays coming from The Bull Durham league. It would appear the trend of dominance by The Natural is poised to continue in 2021. Last year, The Natural went 88-62 (.587) in Season No. 2 and 83-67 (.553) in Season No. 1, for a combined winning percentage of .570 versus Bull Durham opponents. Interestingly, 4 of the bottom 5-ranked teams are also from The Natural.
So how should we think about this metric, Adjusted Total WAR? First, let's start by stating the obvious, WAR is a Bill Jamesian-inspired metric that is designed to capture the degree to which a player contributes to a team's overall success. In the words of Moneyball's Peter Brand (Jonah Hill), "People who run ball clubs, they think in terms of buying players. Your goal shouldn't be to buy players, your goal should be to buy wins. And in order to buy wins, you need to buy runs." From a pitching perspective, you're not buying runs, but run prevention.
The WAR calculation used for this analysis is from Fangraphs and it captures a position player's contributions at the plate and in the field. This is how Fangraphs defines WAR in its glossary:
Wins Above Replacement (WAR) is an attempt by the sabermetric baseball community to summarize a player’s total contributions to their team in one statistic. You should always use more than one metric at a time when evaluating players, but WAR is all-inclusive and provides a useful reference point for comparing players. WAR offers an estimate to answer the question, “If this player got injured and their team had to replace them with a freely available minor leaguer or a AAAA player from their bench, how much value would the team be losing?” This value is expressed in a wins format, so we could say that Player X is worth +6.3 wins to their team while Player Y is only worth +3.5 wins, which means it is highly likely that Player X has been more valuable than Player Y.
Fangraphs notes that the calculation for position players is simply a summation of three separate calculations - Batting Runs, Base Running Runs and Fielding Runs above average - which is then adjusted for their position and level of competition. For instance, a second baseman is compared to the replacement-level value for second base and not first base. As such, a second baseman with 14 homers is likely to be seen as "above average" in that category, whereas 14 bombs would probably constitute a below-average value for first base.
For pitchers, the calculation is heavily dependent on FIP, or Fielding Independent Pitching, as adjusted for park and scaled to how many innings the pitcher threw. FIP is translated into runs, converted to represent value above replacement level, and is then converted from runs to wins.
So if Toronto is at 33.1 Adjusted Total WAR, and Pittsburgh is at 23.0, can the Pirates even compete? Of course they can. Dynasty League introduces many variables, some of which can be controlled by managers and others which cannot. For example, the home ballpark. Does your home ballpark maximize your team's performance? A cavernous park will hide some of those deep drives, yet a short porch in right will accentuate lefty pull power. Weather? The wind blowing out can work for or against a pitcher, or a lineup, and is completely out of the manager's control.
Matchups. A pitcher who shuts down righties may run into a team that can stack the lineup with 6 or more lefties, or a lineup that is lefty dominant may run into a reverse righty buzzsaw. As an observation, it is worth noting that some teams drafted to optimize matchups and assure an ability to compete in any situation. This was often done as a tradeoff for grabbing a player with higher WAR. The result is that their team will likely over-perform its WAR. Hand in hand with this observation is that WAR rewards duration, and drafting for matchups typically involves focusing on role players. For example Rick Porcello had a WAR of 1.7 in 2020 and he went unselected in the MMDBL's Free Agent & Rookie Draft earlier this month. Meanwhile, Dean Kremer and his 0.7 WAR was a high selection. The difference? Porcello started 12 gamed and Kremer just 4. Another factor? Despite Porcello's obscene 5.64 ERA, he registered a solid 3.33 FIP, yet that didn't translate to his DLB card which yields an over .300 batting average and has zero hard ground outs versus lefties despite a groundball rate of 38%. Porcello does have a high frequency of Infield Range results, which probably means the FIP calculation benefits Porcello by having ham-handed Rafael Devers and Xander Bogaerts on the left side of the infield.
Bottom line? Baseball is game of interconnectedness in which a player's success depends largely on environment and circumstance. The wrong park, the wrong defense, the wrong stretch of luck, can doom a pitcher. Conversely, many hitters need to be retrofitted to the park and individual matchups to maximize their value. The winner of the MMDBL season that is now upon us will likely be a team that finds its interconnectedness, regardless of Adjusted Total WAR. It's a metric, and its a great place to start, but it is certainly not where it ends. Play ball.