
Twins Again? C’mon Man, They Must Know the Secret Formula
Somewhere in the bowels of the Metropolitan Milwaukee Dynasty Baseball League (MMDBL) home office there is a vault with the ancient scroll of the MMDBL winning formula. It’s beginning to look like the Minnesota Twins have read the scroll.
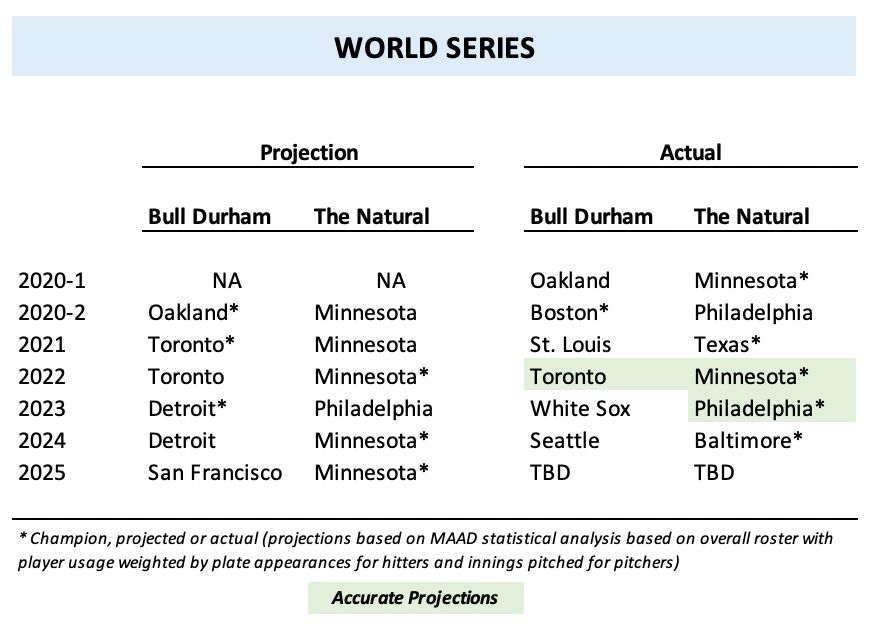
In 5 of the MMDBL’s first 6 seasons, the Twins have been the pre-season favorite in the Natural League, and 3 times they’ve been the World Series favorite. As we head into the 2025 season, the MMDBL’s 7th, it is the Twins who are once again the favorite to win their league pennant and go on and win the World Series, this time beating the projected Bull Durham pennant winner, the San Francisco Giants.
In fact, the only team in the Natural other than the Twins to ever claim status as the pre-season favorite is the Philadelphia Phillies in 2023, and the Phillies won the World Series that season. In the Bull Durham, this is the first time San Fran has been the pre-season favorite, following twice by Detroit (originally Boston), twice by Toronto (now Pittsburgh) and once by Oakland (now Seattle).

Have the Twins cracked the code? The code – let’s just go with that – heavily favors certain attributes for run production and run prevention that the Twins are routinely stacked with. For run production, it favors on-base, slugging, and productive outs. For run prevention, it favors reducing opponent walks, hits (especially homers and bases-clearing doubles), and anti-productive outs (strikeouts and double plays). This season, for the first time, adjustments were made to the run production algorithm for baserunning; and adjustments were made for the run prevention algorithm for defense. In the 2025 projections, these adjustments had a significant impact. More on this later.
MAAD Science
To refresh, each year the under-funded MMDBL Advanced Analytics Department (MAAD) runs a proprietary algorithm at the player level to determine each players’ value. For pitchers, a lower score is better (i.e., the Pitch Score); for hitters, a higher score is better (i.e., the Hit Score). The algorithm produces scores for each player versus lefties and versus righties, and then an aggregate player score based on their expected probability of facing lefties and righties.
The quantitative method used is based on statistics validated to be most material to run production and, for pitchers, run prevention. The methodology uses actual card results – not MLB results – so it catches Dynasty’s nuances for over-rating or under-rating certain player types, or personas.
Team projections are based on weighted-average real-life usage. For hitters, the team Hit Score is based on weighted-average plate appearances; for pitchers, the team Pitch Score is based on weighted-average innings pitched. This approach does not – emphasis on “does not” – take into account how an MMDBL manager will actually use his players. For instance, you could have a poor hitter with 500 plate appearances, or a lousy pitcher with 135 innings, on the 40-man roster that you never intend to use unless in the case of an injury. However, they factor into the quantitative analysis and will worsen the team scores due to their high real-life usage. Likewise, you could have a hitter who only went to the plate 106 times, but who has a stellar card and no playing limitations other than “F” durability. If this player avoids injury, he could take most of the team’s at bats at his position, yet with 106 real-life plate appearances his usage will be under-weighted in the team Hit Score (yes, that’s you Trevor Story.)
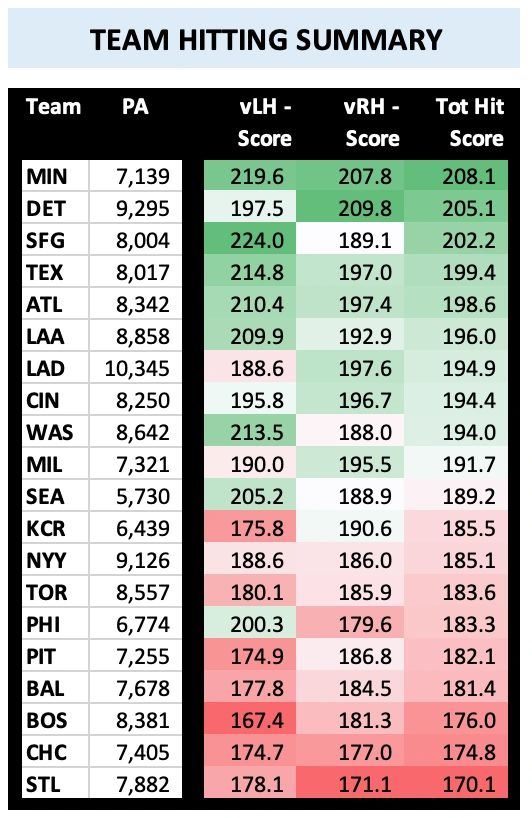
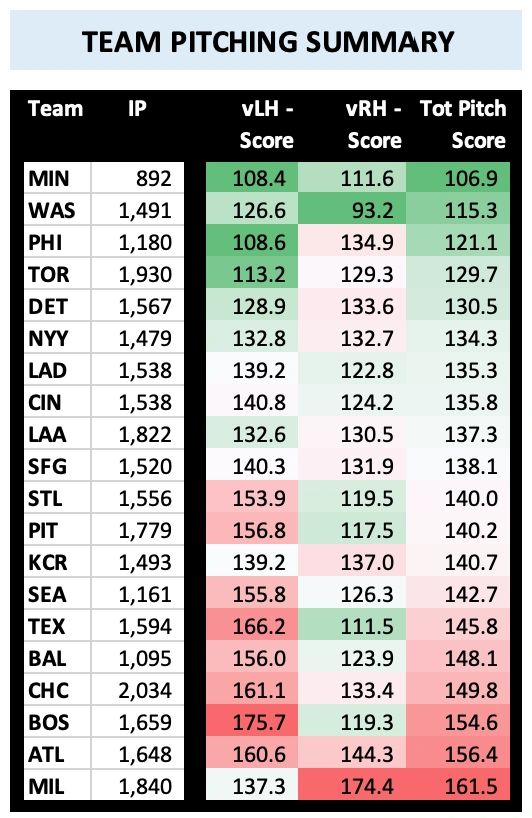
Dynasty playing limits and injury ratings have the potential to materially impact usage in the MMDBL season, yet they are not factored into MAAD’s quantitative method. If an “F” player goes down early, boom! The run production and run prevention estimates take a massive hit. Ratings such as “clutch”, “jam”, jam+”, “on”, and “off” are factored into the equation based on frequency of occurrence, as is the hitter's power rating.
When calculating a pitcher’s opponent batting average, opponent on base, and opponent slugging, 30% of deep drives are considered homeruns. The ballpark and opposing hitter’s power, obviously, impact actual outcomes, but the model applies this fixed value for the sake of consistency.
With the exception of deep drives, all other card results that need additional input to determine the outcome are considered outs in the Pitch Score and Hit Score calculations. This includes error, bizarre, umpire, infield range and outfield range. Cumulatively, these total approximately 17.5% of outcomes. How many games have you won or lost due to an error, or a range play, or even a passed ball or catcher handling result? Probably a fair amount. MAAD’s data scientists understand this gap in their predictive model and are working to close it by incorporating defensive values first before moving on to more complex play outcomes.
Errors account for 6% of outcomes, and range plays account for an average of 7.5%, though this can vary significantly from pitcher to pitcher. Of range plays, on average, 70% are infield results and 30% are outfield results, though this can also vary widely among pitchers. The future MAAD model will incorporate not only error and range ratings but consider their frequency of occurrence for each pitcher, and this will be rolled up into the team rankings. Look for this enhancement in 2026.
New Team-Level Adjustments
In lieu of this enhancement, and for the first time ever in the 2025 projections, base running and defensive adjustments were made at the team level to sharpen the Expected Wins (ExW) estimates. These adjustments were made solely based on a team’s defensive wins above replacement (dWAR) and its base running runs above average (BsR), and not on card values. MAAD bounded the positive and negative effects of these adjustments to a cumulative plus-3 or negative-3 ExW, of which +/- 2.25 ExW could be attributable to defense, and +/- 0.75 ExW could be attributable to baserunning.
In the 2025 projections, this boosted Toronto dramatically, earning the full +3 ExW. Toronto not only has the best dWAR by 20.1, but also the best BsR. Other teams with meaningful positive adjustments to ExW include Philadelphia, Texas, and New York. Teams that saw meaningful negative ExW adjustments were Detroit, Cincinnati, Atlanta and the Los Angeles Dodgers. San Francisco got a very small positive adjustment due to its BsR and Minnesota got a small negative adjustment but still managed an ExW of 58.
Once the card-based error and range ratings are considered in the player-level calculations, MAAD will remove them from the team-level adjustments.
Team WAR and ExW Projections
The 2025 projection calls for a 3-way 52-win tie atop the Bull Durham between San Francisco, Toronto, and Detroit with the Giants taking the top score by a 1/10th of a win. Texas, New York and Seattle round out the Bull Durham playoff probables. If there’s a storyline for the Bull Durham entering this season it’s that the gap between the top and bottom of the Expected Wins projection is the narrowest any league has ever had in the MMDBL – only 15 games separate the top and bottom. A key trade, injury, or unexpected level of performance – good or bad – could shift fortunes quickly.
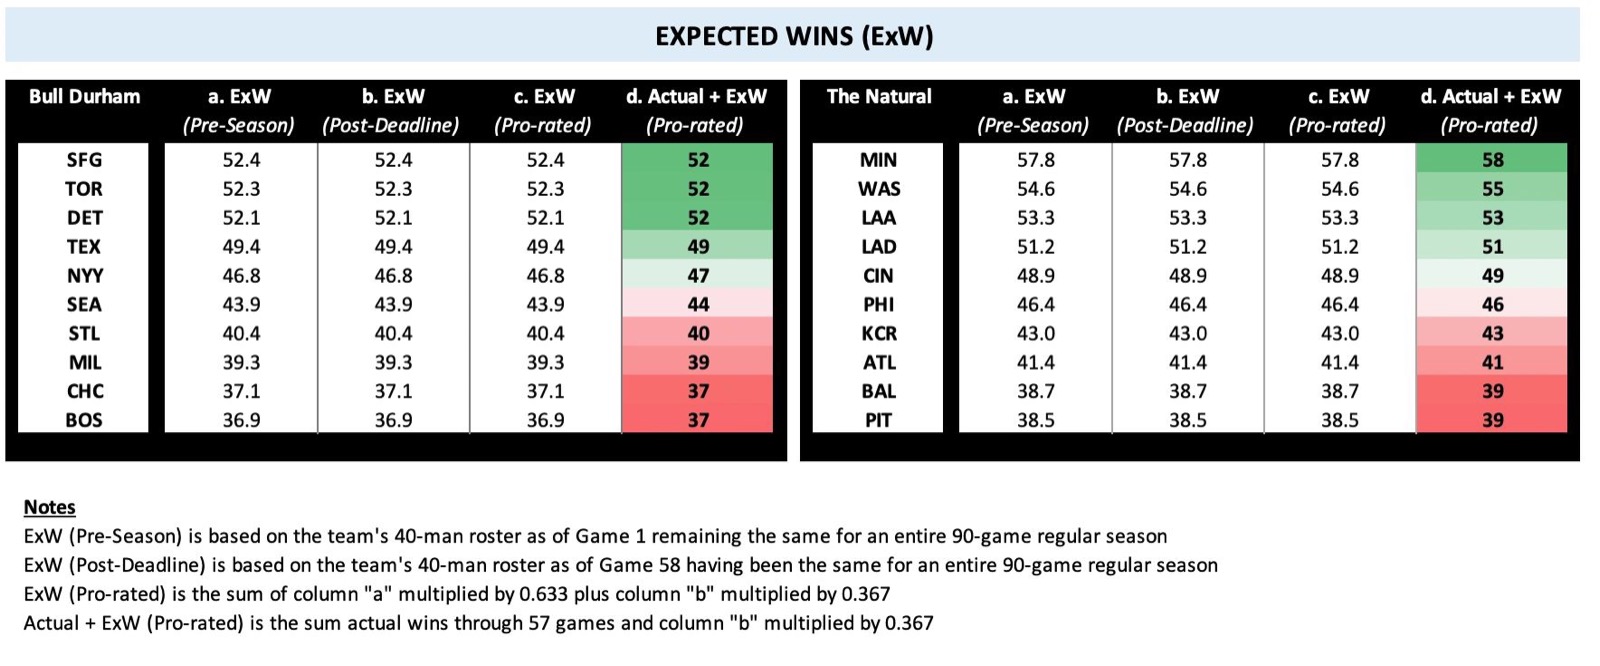
In the Natural, Minnesota is again the consensus favorite entering the season, projecting to 58 Expected Wins. The Nationals project to 55 ExW, followed by the Angels with 53 and the Dodgers with 51. Rounding out the Natural’s playoff probables are Cincinnati and Philadelphia. The World Champion Baltimore Orioles look like they have an uphill climb to defend their title, projecting to only 39 wins.
It bears noting that the ExW projection often differs greatly from the team WAR rankings. If we use team WAR, the top 6 teams in the Bull Durham are 1) Toronto, 2) Texas, 3) New York, 4) Detroit, 5) San Francisco, and 6) Boston. Using team WAR, the top 6 in the Natural are 1) the Los Angeles Angels, 2) Washington, 3) the Los Angeles Dodgers, 4) Pittsburgh, 5) Minnesota, and 6) Atlanta.
So, will it be the Blue Jays versus the Angels in the World Series, as team WAR would suggest? Or will it be San Francisco and Minnesota, as the ExW methodology would suggest?
Chances are, neither outcome occurs. That’s the beauty of the MMDBL. A lot can happen in a 90-game season and projections are, just that, projections; meaningless in the grand scheme of things, but fun to talk about until the first pitch is thrown.
So, let’s throw the first pitch. Play Ball!