
Twins Statistically Poised To Be MMDBL's First Two-Time Winner
As we embark on Season No. 4 in the MMDBL, the science of predicting outcomes remains, well, an art.
Data provides insights into which teams are poised to bash lefty starters, pluck righty aces, and shut you down from the 7th inning on, but we all know that data is merely an indication of probabilistic outcomes.
But baseball is often a deterministic world. You bring in that lefty specialist, but the opposing manager goes to Jordan Luplow (2019 version) and you’re toast. Your lineup pumps righty aces with plucky lefty hitters, but the opposing manager decides to toss a reverse-righty.
Math loses.
With that caveat – and remember this caveat, please – we give you a data-driven perspective on team strengths and weaknesses for the 2022 campaign. We also provide a hedgy prediction: 2022 presents a real strong opportunity for the MMDBL’s first two-time champion. The champions of the first three seasons – the Twins, Red Sox (now Tigers) and Rangers – are among the Top 6 teams in total Wins Above Replacement (tWAR). As we’ve recounted in prior blogs, tWAR is merely one measure of total roster strength. However, it doesn’t capture playing card and manager use nuances. Every team has that high-WAR player that simply won’t match that performance when opposing managers have the benefit of complete hindsight. They also have those “matchup” players that are not stars in real-life but veritable Gods in Dynasty League Baseball.
Fact. And Truth.
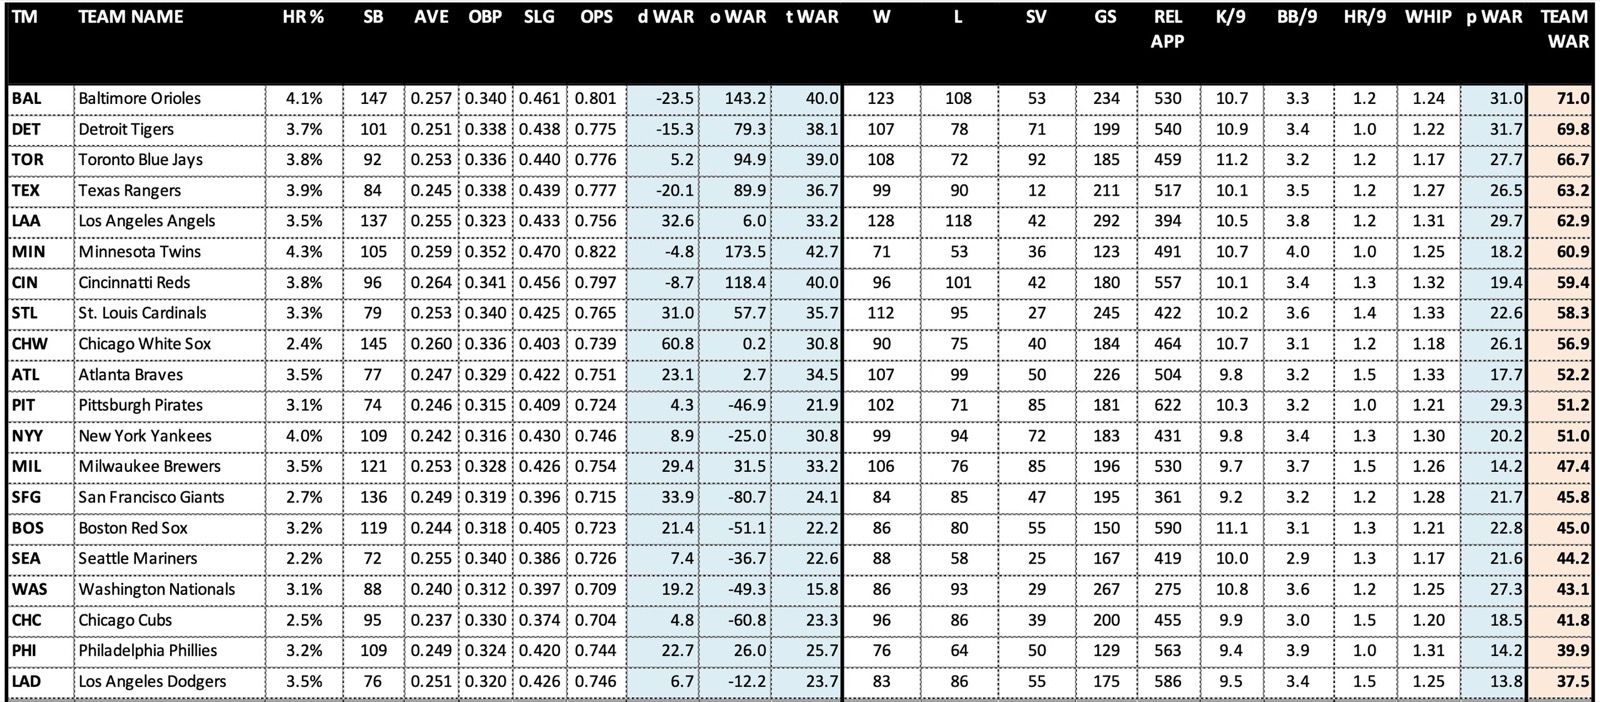
When we look at MMDBL teams in terms of tWAR, we would naturally expect the World Series would be the Orioles versus Tigers. The Orioles have a star-studded roster that produces 71.0 tWAR. The Tigers have a pitching-dominant roster that produces tWAR of 69.8 (though it was league-best before the Marcus Semien trade). Next in line are Toronto (66.7 tWAR), reigning champs Texas (63.2), Anaheim (62.9) and the Twins (60.9).
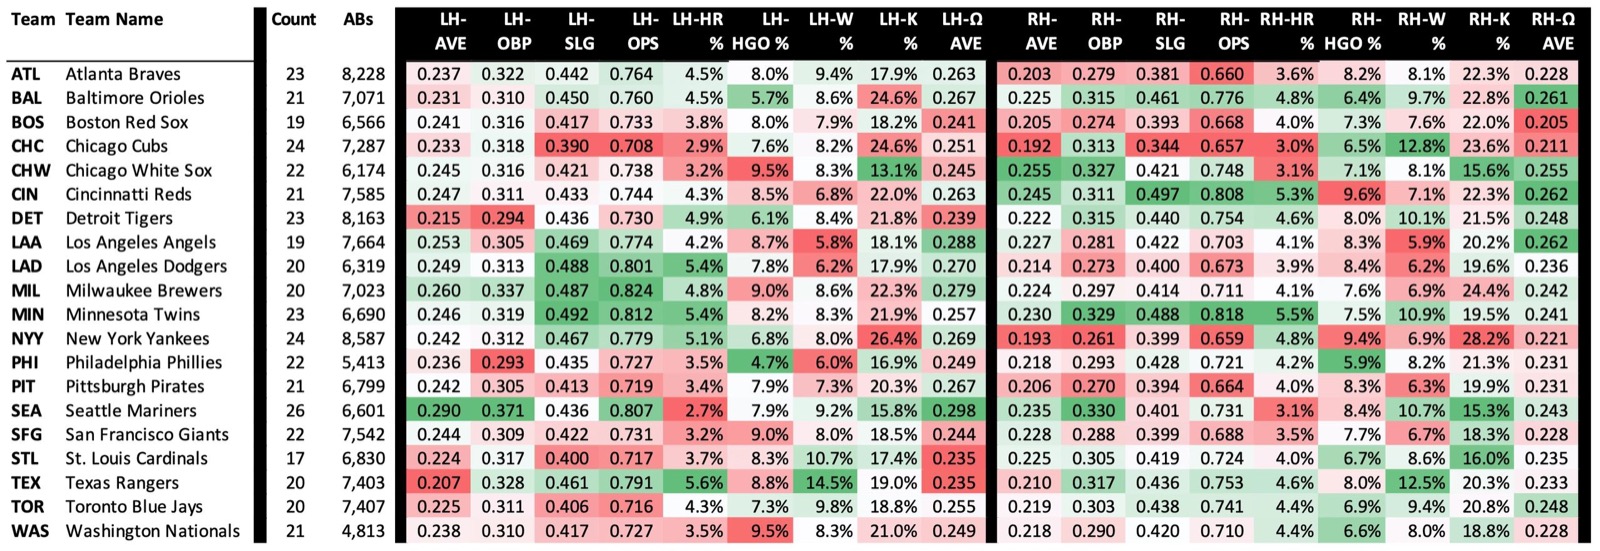
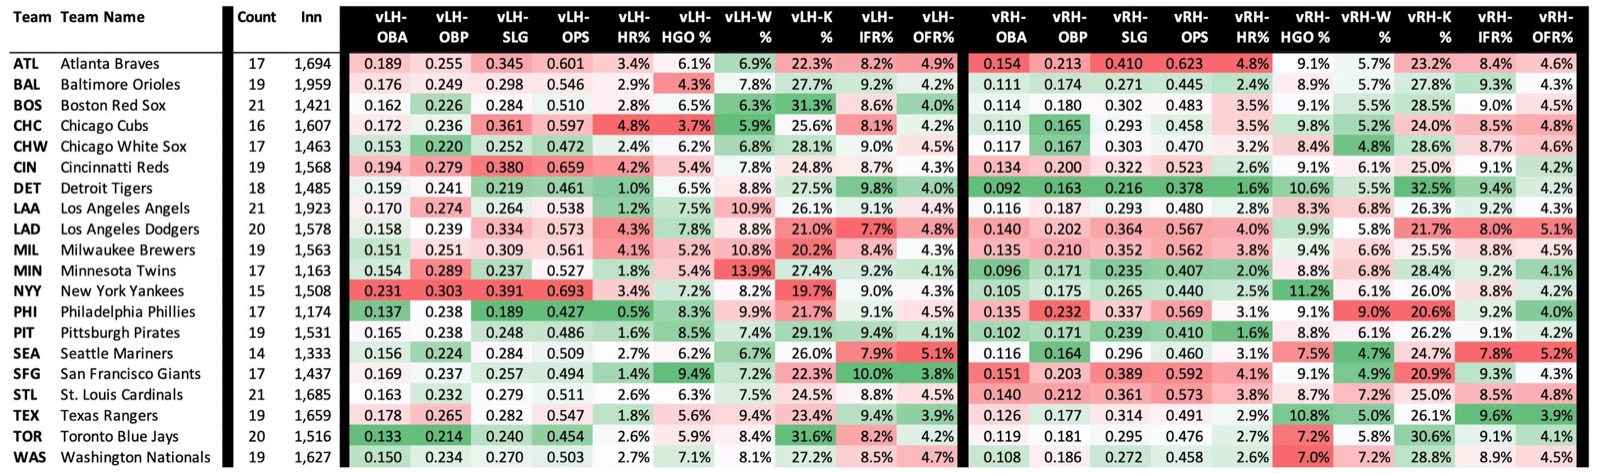
This prognosticator is not yet willing to put Street Cred on the line and predict that the World Series teams don’t come from that lot. “Advanced metrics” – notice the air quotes – suggest the battle for glory will be more competitive but could, in fact, come down to those 6 tWAR leaders. So what are these “advanced metrics” of which we speak? They are the weighted-average results of actual card results across several key card outcomes computed and aggregated per team. Pitchers are weighted according to innings pitched and hitters are weighted according to at-bats. Pitchers with a lot of innings and hitters with a lot of at-bats will more heavily influence the weighted averages, and vice versa.
But we all know that MMDBL managers don’t use players according to their major-league usage, and therein lies the flaw of playing card evaluation. Still, this method speaks to 40-man roster strength and depth, with a lot left to interpretation in terms of 26-man roster composition and playing situation usage (managers, that’s on you!)
This is where the Twins rise to the top. The Twins rank among the top 3 in several hitting categories versus both lefties and righties, and in several pitching categories, especially against right-handed hitters. The numbers are compelling, making it hard to bet against the Twins.
Twins in 6. But against who? The plot thickens.
(Note: Data used for this analysis is available for purchase through Design Depot. Please contact them for access to pertinent csv files.)