
Week 10 - Is There Still Time To Regress to the Mean?
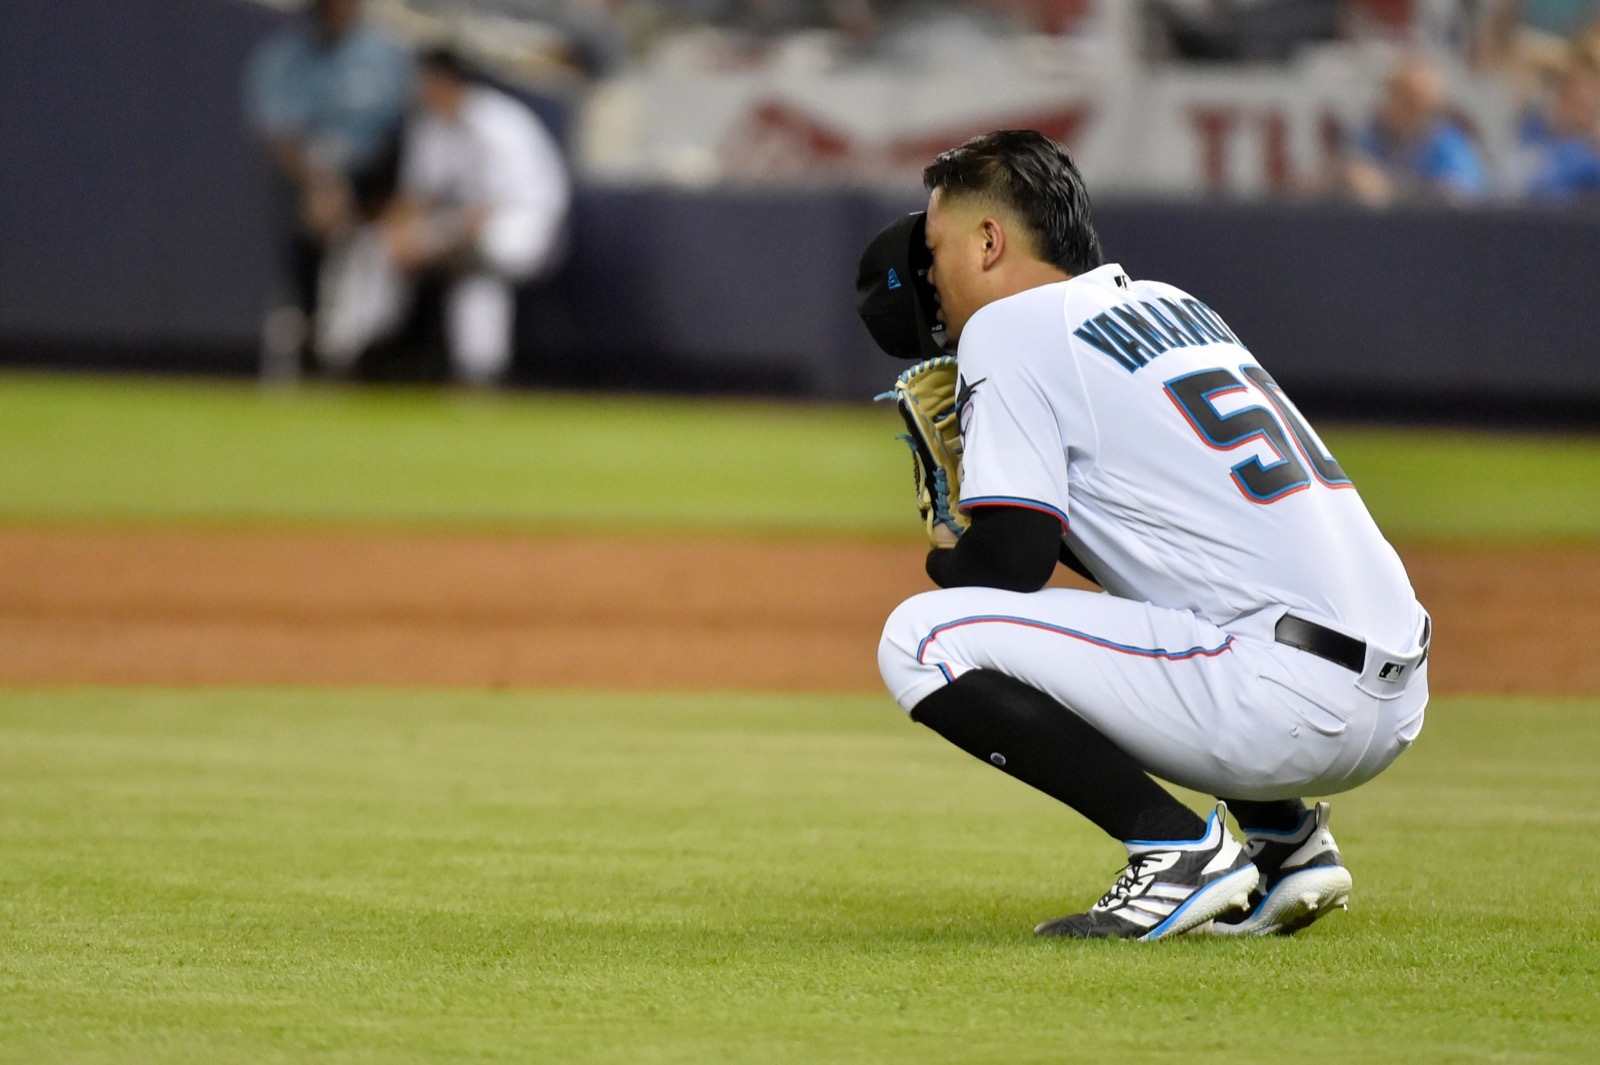
After 30 games, each team is looking at their individual player stats and shaking their heads and, in some cases, their fists. Players who they thought would be stellar are woefully under-performing; and then there are those players that are lighting it up entirely unexpectedly.
Everyone is waiting for, and expecting, a regression to the mean for those over-performers, and a progression to the mean for those under-performers. But is such a snap back to reality a probability in a 54-game season? Are 24 games enough time to make it happen? And who are the biggest candidates for regression and progression to the statistical mean?
Normally when asking such provocative questions I’d prefer to answer them empirically. I’d prefer to compare MMDBL individual player stats with their MLB stats, normalize them based on the overall MMDBL performance relative to the real-life majors, and identify the outlier performers based on key metrics, such as WAR, OPS, WHIP, or batting average using a multiple regression analysis showing the dots farthest from the statistical mean. I’d prefer to situationally normalize the dataset, as well, since outlier performers may benefit from situational usage that enhances their performance. For pitchers, I’d also prefer to throw out the one bad performance they might have had that is skewing their overall statistics.
But no one is paying me to be that precise so I’ll take a less empirical path to identifying the one full-time player per team that seems to be, on balance, an incredible outlier with 24 games to go. For hitters, I’ll focus on the slash line, and for pitchers I’ll use WHIP and opponent batting average (OBA). And since this is a tad bit of work, I’ll break it into two blogs with this one covering Atlanta through Minnesota, and the next blog covering New York through Washington.
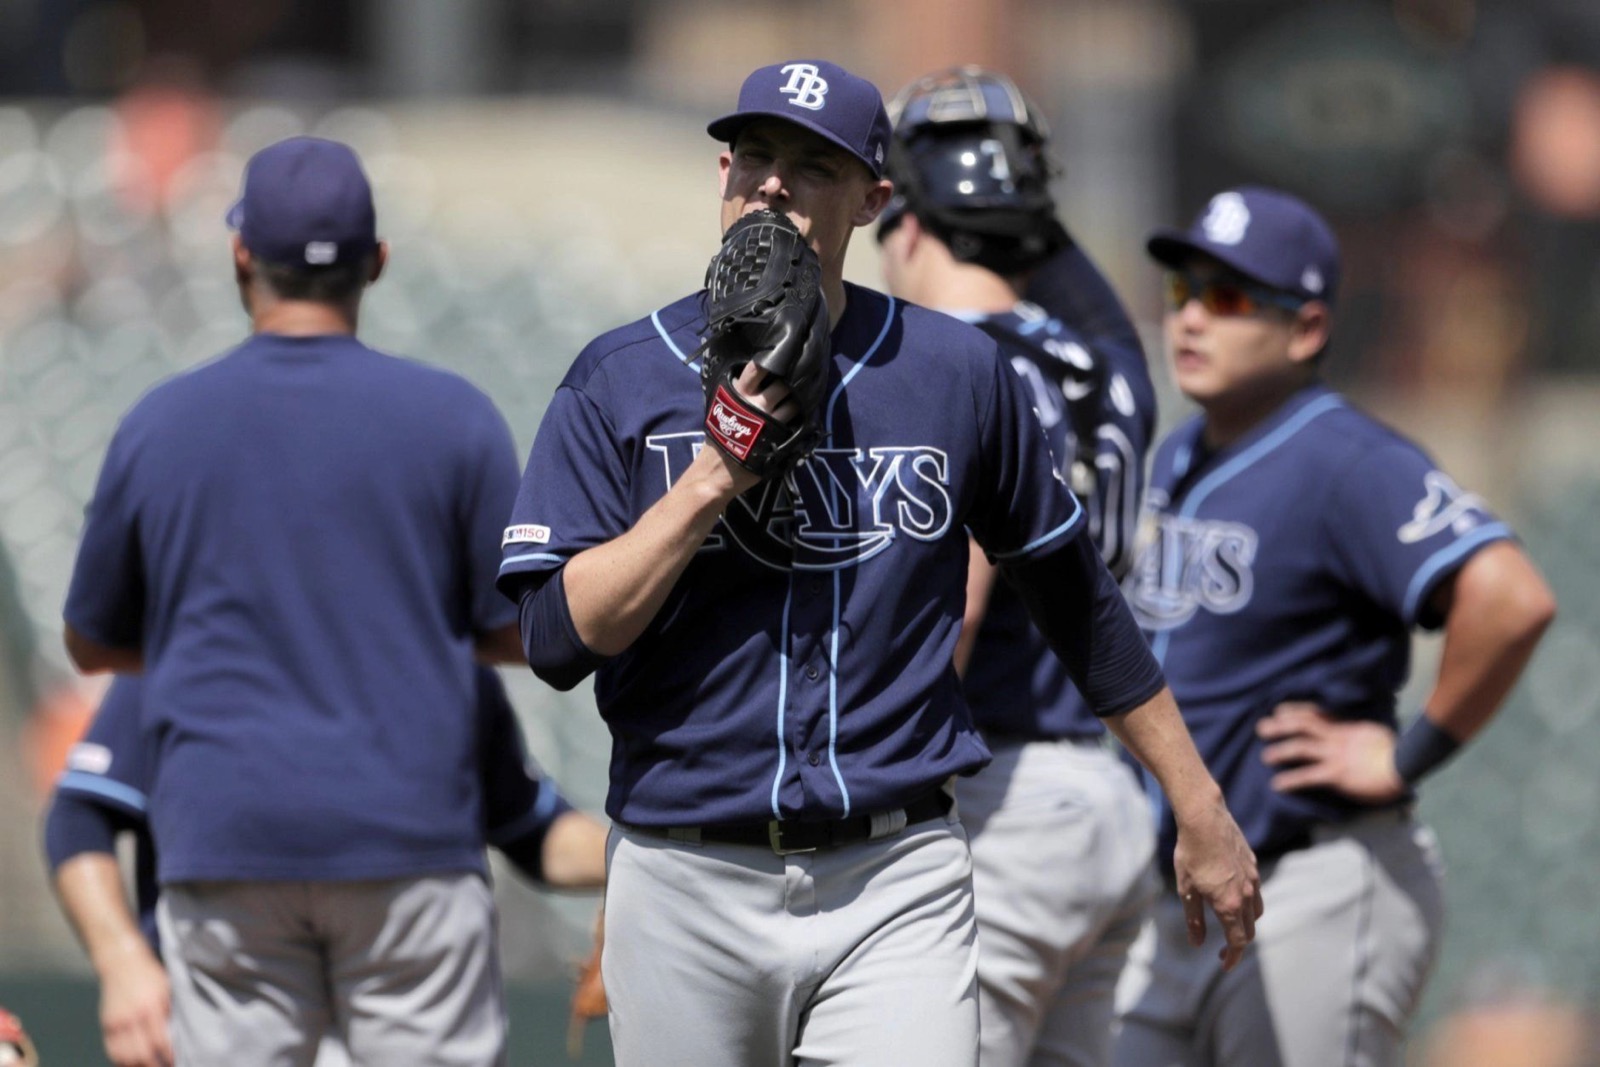
Atlanta – Ryan Yarbrough yielded a .227 OBA and WHIP of 1.00 in the MLB, but he’s been lit up for a .325 OBA and a 1.71 WHIP so far over 7 starts covering 28 2/3rd innings – about 4 innings per start. The Braves have other worthy candidates in their batting order – such as the underperforming Anthony Rizzo (.239), Bryce Harper (.221), and Xander Bogaerts (.206) – but Yarbrough’s performance is so glaringly bad that he gets the crown.
Baltimore – So a lot is going right for the Orioles right now. Ronald Acuna Jr. is a candidate on the downside, believe it or not, but slashing .250/.323/.471/.794 vs the real-life slash of .280/.365/.518/.883 just isn’t off mark enough. What is off mark is Mitch Moreland rocketing 11 homers in 108 plate appearances this season after bashing 19 in 335 PAs in real life. That’s 1 homer every 9.8 PA versus every 17.6 PA.
Boston – With a team hitting .287 through 30 games, you’d expect the Red Sox to have as many offensive regression candidates as a boy band at its peak. However, when you consider the hitterish tendencies across the whole league this season, no full-time hitting starter is quite as outlandishly good as starting pitcher Jose Berrios has been outlandishly bad. Still, it’s hard to pick a guy who is 4-2 with 2 complete games, even though his OBA is .311 (vs .248 in the MLB) and his WHIP is 1.78 (vs. 1.22 in the MLB) through 44 1/3rd innings. So we’re going to go with a part-time guy – Ehire Adrianza. Batting typically out of the 9-slot, Adrianza has gone .358/.395/.556/.951 (vs .272/.349/.416/.765 in the MLB) and he has 4 doubles, 3 triples and 2 homers while logging 20 RBIs, 3rd best on the team, in just 86 PAs.
Chicago White Sox – This is as easy as it gets. Last season, the franchise watched as Christian Yelich woefully underperformed. This season, Yelich is a respectable .300/.409/.591/1.000, but it’s the team’s other mega-star that is flailing. Mookie Betts is slashing just .245/.339/.391/.729 in a season in which he went .295/.391/.524/.915 while compiling 6.6 WAR in real-life. Some of those slash metrics may not seem far off but when you consider a) he’s giving up almost 200 points of OPS, and b) the league as a whole is performing offensively better than in real-life, that puts his lack of production in perspective. If you need more proof, Adrianza has hit as many homers and has 5 more RBIs in fewer PAs than Mookie. Oof.
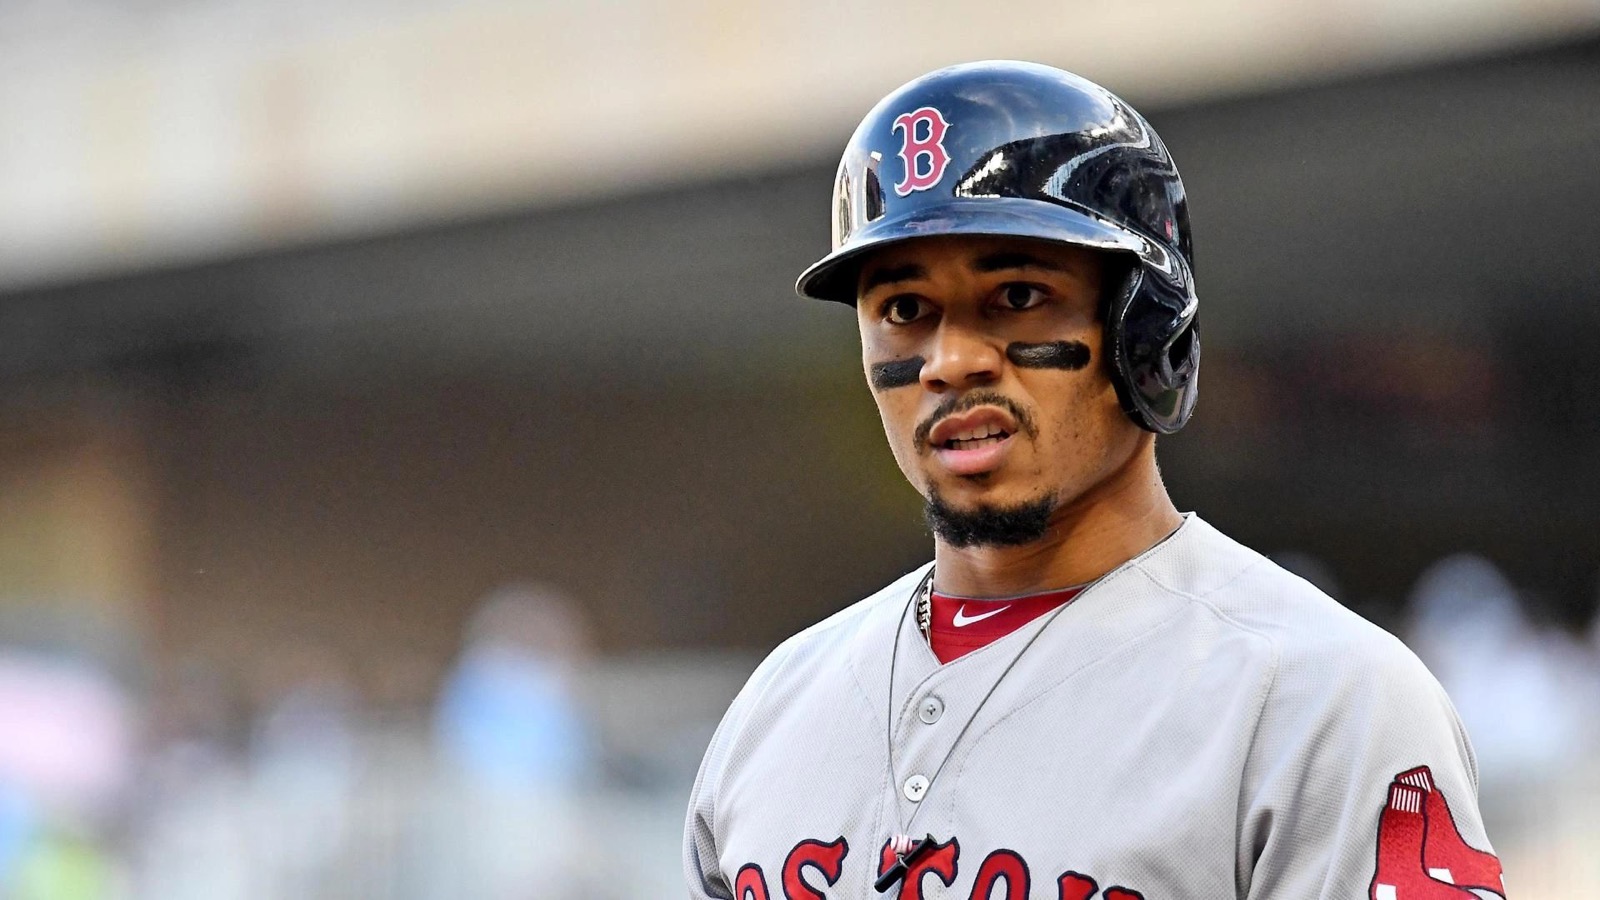
Chicago Cubs – Choices, choices. The Cubs moved from Colorado but seem to have ticked up offensively. But despite not pitching in the humidor anymore, run prevention has taken a step back. The whole team is pitching crappy, leading the way with a league-worst 1.64 WHIP. So there’s a lot of good choices for top under-performer on the staff. But one stands out – Trevor Bauer. He is supposed to be the ace, the stopper. Yet he’s been a gas can, going 1-5 in 7 starts while yielding a .310 OBA, a 1.78 WHIP and an 8.42 ERA in 31 innings. That compares to his MLB line of .227 OBA and 1.22 WHIP. Oh well, the Cubs will love the Cy-worthy card Bauer is likely to get for next season.
Detroit – The pitching staff has failed to provide. Up and down the line – in the rotation and in the bullpen – the Tigers sport eye-popping WHIPs. Twenty-two of the team’s 30 starts have come from guys with WHIPs exceeding 1.53. But the worst of the worst has been Cole Hamels. To be sure, Hamels wasn’t his vintage self in the MLB season, going 7-7 with a 1.39 WHIP and a 3.81 ERA. He also allowed a .255 OBA while producing a 2.5 WAR over 27 starts. So far in the MMDBL this season, Hamels has been brutal. In 4 starts he’s yielded a .333 OBA, a 2.02 WHIP and a 9.33 ERA.
Houston – This is a harder choice than most. The Astros have a lot of guys performing reasonably within reach of their actual 2019 results with no full-time player standing out as an obvious outlier. Some are performing better, though the eye test suggests there are more under-performers. Visualize the statistical mean with a lot of orange dots close by and none really way off. But we have to pick one; we can’t abstain. We’re going with Alex Young. The pitcher has started 4 games, relieved in 6 more, and tossed 19 miserable innings. He has amassed a .308 OBA and 1.79 WHIP (vs. .226 and 1.19 in the MLB). The saving grace is that Young has an 0-0 record with no saves and no blown saves, so no harm, no foul.
Los Angeles – With so much offense, surely there’s a hitter who is massively over-performing, right? Well, Mitch Garver has 15 homers, almost halfway to his real-life total of 31 in 29% of the PAs. But Garver had a dominant 2019 season as the best hitting catcher in the majors, so it’s hard to ding him for being the best hitting catcher in the MMDBL. To find our ideal selection we have to go deep into the bullpen – a bullpen that leads the league in blown saves. There, we find Roberto Osuna who has labored to a .321 OBA, a 1.71 WHIP and a 6.27 ERA in 18 1/3rdinnings over 14 appearances. Of course, Osuna was one of the best relievers in baseball in 2019 with a paltry .188 OBA and 0.88 WHIP.
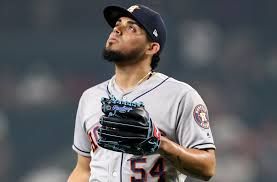
Milwaukee – The Brewers are chasing the first pick in the 2021 Spring Draft so there’s not likely to be too many players performing above expectations. Upon inspection, that is clearly the case. Interestingly, the most egregious under-performers share two traits – they are starting pitchers, and they are lefties. Eric Lauer, David Price, Jon Lester and Brett Anderson are their names. None of them lit the world on fire in 2019, but Anderson pitched well enough to get a “jam” rating. Yet he’s the one pitching the worst so far for the Brewers, sporting a 1-4 record and 8.68 ERA while yielding a .352 OBA and 2.18 WHIP (vs .262 and 1.31 in the MLB).
Minnesota – The Twins are off to a decent start but they are not dominating Season #2 like they did in Season #1. In Season #1, everything clicked. They were 2nd in OPS and a runaway 1st in WHIP (1.07 vs 1.20 for the runner-up). One of the best contributors in Season #1 was Jordan Yamamoto. In his 6 starts he was 5-0 with a .169 OBA, 0.84 WHIP and 2.13 ERA over 38 innings (vs .190 OBA and 1.14 WHIP in the MLB). Yamamoto’s Season #1 performance was a slight outlier on the upside. Perhaps Season #2 is an over-correction to the statistical mean. In 6 starts, Yamamoto has only been able to last 14 2/3rd innings – slightly more than 2 innings per outing – while going 0-4 with a 15.34 ERA and yielding a .302 OBA and 2.25 WHIP. Numerically, he has one of the stingiest pitching cards in the deck. Put it all together, and Yamamoto is probably the leader in the clubhouse when it comes to outlier performances through 30 games.