
Welcome the Tigers and Twins, this Summer's Paper Dragons
With Opening Day 2024 upon us, it is time for some perspective. Every team has hopes and dreams, but some are more equipped to make them come true than others -- at least "on paper."
Who in the MMDBL appears most likely to be playing meaningful baseball in the Fall?
Great question. And, as usual, we’ve asked the MMDBL Advanced Analytics Department (the “MAAD”) to crunch some numbers and provide a little insight. MAAD looks at Wins Above Replacement (WAR) and weighted-average card outcomes. However, MAAD does not consider some really key factors such as how managers intend to use their players, including whether or not that .201 hitter will ever contribute in any manner other than by dragging down the team’s weighted-average card outcomes. Also – notably – defense, baserunning and other intangibles (arms, pitcher hold, injuries, etc.) are not considered in the weighted-average card outcomes and, as we all know, these factors can materially change results.
Let’s start with WAR. WAR is a cumulative statistic, which means that players who had more plate appearances and threw more innings are likely to have more WAR. That said, it is still a decent indicator of value. Going strictly by WAR, we would expect to see the Baltimore Orioles or the Los Angeles Angels representing The Natural League in the World Series against the Detroit Tigers, representing The Bull Durham League. The Orioles and Angels are tied with the most WAR (74.8) in the MMDBL, and the Tigers are a distant third with 66.8 WAR.
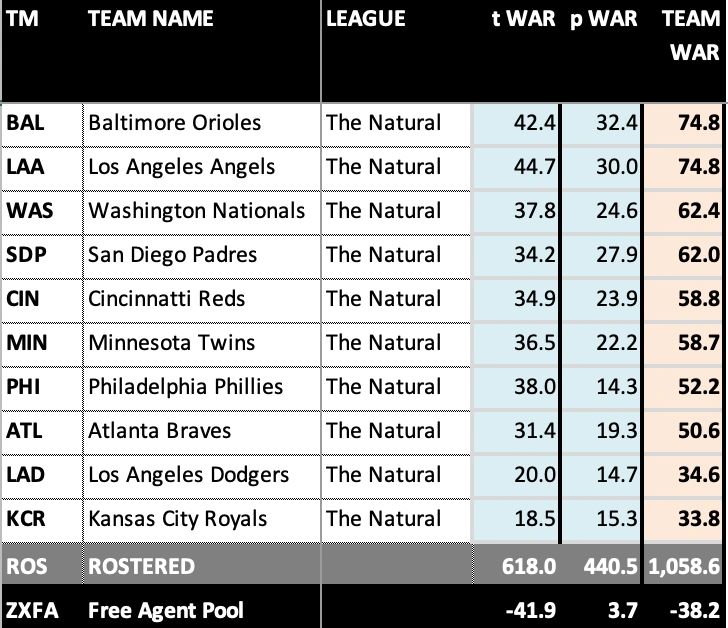
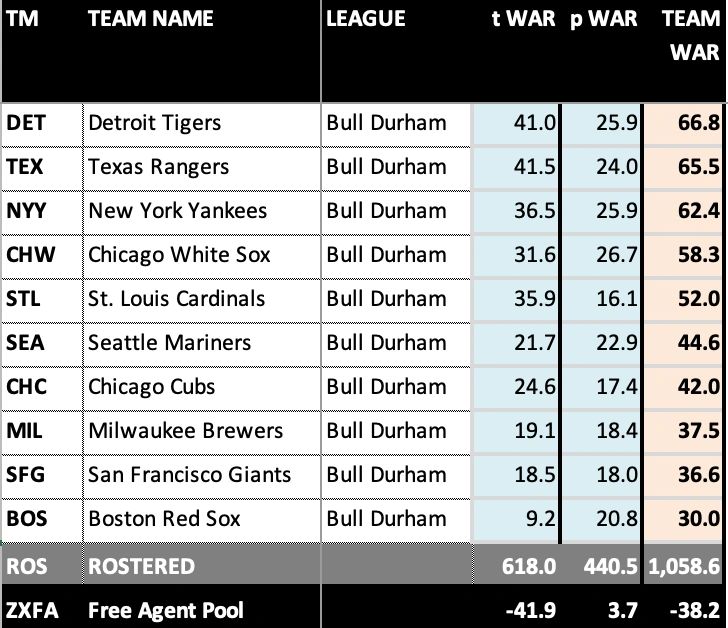
According to WAR, the Natural’s 6 playoff teams would be the Orioles, Angels, Nationals, Padres, Reds and Twins. Notably, according to WAR, the Phillies would not have the opportunity to defend their championship. We’ll see about that. In the Bull Durham, according to WAR, the 6 playoff teams would be the Tigers, Rangers, Yankees, White Sox, Cardinals and Mariners.
Based on WAR, the best hitting teams, in order, are the Angels, Orioles, Rangers, Tigers, Phillies and Nationals. And the best pitching teams, in order, are the Orioles, Angels, Padres, White Sox, Yankees and Tigers.
The teams in the Jackson Holliday, Jackson Chourio, Paul Skenes, Junior Caminero and Wyatt Langford sweepstakes – based solely on WAR – would appear to be the Red Sox, Royals, Dodgers, Giants and Brewers. These teams all have less than 40.0 WAR.
Hit and Pitch Scores (Only Here to Lead Us Astray!)
Setting WAR aside, another metric to consider is weighted-average card outcomes. MAAD has created a proprietary value score for hitters and pitchers. The “Hit Score” considers the ability to get on base and drive in runs. It is most closely aligned with On-Base-Plus-Slugging (OPS), but it considers the impact of strikeouts and double plays, which are value-accretive for pitchers and value-decretive for hitters. Explosive hits that move runners 2 or more bases have more impact – positive for hitters, negative for pitchers – than walks, hit by pitches and station-to-station singles.
A Hit Score and Pitch Score metric is calculated for each team, and then a weighted score that combines the two hitting and pitching “handedness” metrics into one team Hit Score and, separately, a Pitch Score is calculated. MAAD piloted this analytical approach beginning in 2021. The approach was modified substantially in 2022 and again last season. Results so far have been mixed. This is largely attributable to the fact that the analytical approach doesn't consider defense, base running, park factors and player usage. For instance, MMDBL managers don't deploy their players in proportion to their MLB usage but rather in relation to their own game and situational strategies.
Based on last year’s results, however, there are three takeaways. First, teams with better Hit Scores (higher is good) and better Pitch Scores (lower is good) have a higher floor on overall performance and a narrower band of outcomes. In other words, teams with rosters that scored better ultimately performed better overall.
Second, teams that have wide variations in “handedness” scores are prone to more volatile outcomes that tend to skew downward. What this means is that a team that is dramatically better versus left-handed pitching, for instance, faces less left-handed pitching as a result. And teams whose pitching staffs are geared to getting right-handed hitters out at a demonstrably better rate, for example, face a disproportionately higher number of lefties. We call this “getting worked”, and teams that had volatile split metrics in 2023 got worked more often in a fashion that suppressed their strengths. The best example in 2023 was Milwaukee. The Brewers had the best Hit Score versus lefties of any team. And they produced against left-handed pitching, posting a league-best .313/.398/.497/.895 slash line. But here’s the kicker – they only faced lefties in 447 plate appearances (PAs) all season, which was 53% of league-average.
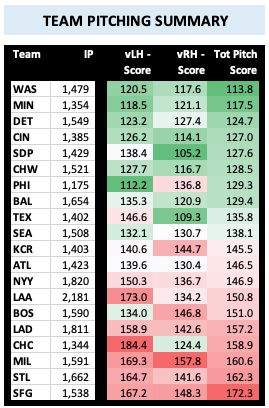
Third, while teams with lower Hit Scores and higher Pitch Scores (remember, low is worse for hitters and high is worse for pitchers) tended to perform worse overall in 2023, they overall had a wider variation in outcomes. This means that some poorer-scoring teams made the playoffs and were managed in a fashion that suppressed their weaknesses. The best way to suppress a weakness is to not play it. For example, a .207 hitter with 500 PAs or a pitcher with a 1.55 WHIP over 135 innings pitched (IPs) will adversely impact the weighted-average Hit and Pitch scores, yet they may never see the field the entire season. This is a nice way of saying that a manager with poorer Hit and Pitch scores has a greater opportunity to “manage up” the team’s results through player usage decisions than a manager with better scores to work with.
Another reason for the variation is the stadium in which a team plays most of its games. For example, in 2023 there were many instances of teams whose Pitch Scores were suppressed by ‘Deep Drive’ result chances but which benefitted from playing their home games in a cavernous park (e.g., San Fran, which made the playoffs). Another reason for pitching and hitting variances from expected outcomes is defense. The Hit and Pitch score metrics do not consider defense which, on average, impacts approximately 13% of outcomes (6% for errors, 7% for range) and this does not include catcher handling and passed-ball or pitcher hold ratings. You can also add baserunning and stealing to the list of non-considered factors. In 2023, no teams maximized their results more with speed and defense than the Giants and the World Champion Phillies. (The MAAD’s Director of Analytics has indicated a desire to advance the quantitative effort to estimate player usage based on expected optimal use patterns including defensive impact – a noble goal!)
So who are Hit and Pitch score leaders and laggers for the 2024 campaign?
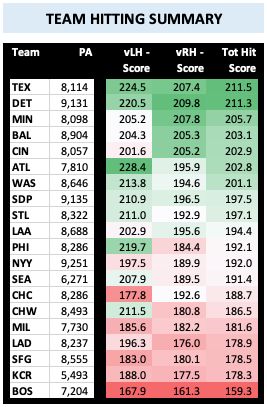
The overall Hit Score leaders are Texas, Detroit, Minnesota, Baltimore and Cincinnati. The laggers are Boston, Kansas City, San Francisco, the Dodgers and Milwaukee. The overall Pitch Score leaders are Washington, Minnesota, Detroit, Cincinnati and San Diego; and the laggers are San Francisco, St. Louis, Milwaukee, the Cubs and the Dodgers.
Translating Metrics Into Expected Wins
MAAD takes the expected outcomes and calculates an expected win total for each team. Last year, two teams shattered their expected win totals – the Giants and the White Sox. The World Champ Phillies scored high overall largely because of a dominant Pitch Score that over-compensated for a middle-of-the-pack Hit Score versus righties, and yet the Phillies went out and outperformed their Hit Score dramatically. No one would argue that the Phillies success in 2023 didn't start with outstanding pitching, but the over-performance at the dish was critical to winning the World Series. Just getting an extra run with speed, or avoiding one with defense, was unquestionably worth more than a handful of wins.
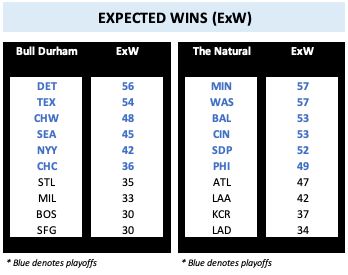
We need to provide a bit deeper context for the Expected Wins (ExW) totals. These are mean results. The range below the mean will be thinner and the range above the mean will be thicker for poorer scoring teams. Conversely, the range up and down will be generally equal for higher-scoring teams and the bandwidth of outcomes will be narrower. Also, it’s critical to note that strength-of-schedule is not considered, and the ExW totals are not footed to a league-wide outcome. In other words, it is possible for the ExWs to sum up to a figure greater than or lesser than 900, which is the number of regular-season games we will play in the MMDBL this season. Coincidentally, this season’s ExW totals sum to 890, with 54.0% of the Expected Wins coming from The Natural Division. In fact, only 4 teams project to finish .500 or better in the Bull Durham versus 7 teams in the Natural based on the Expected Wins metric. This only reinforces the "Senior versus Junior Circuit" narrative that has existed since Year One.
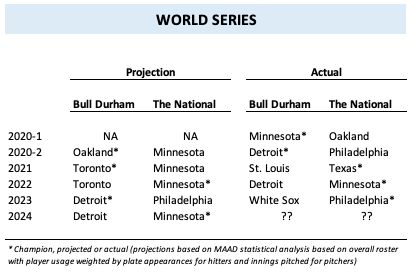
So this brings us to the moment for which we’ve all been waiting. Who will compete in the 2024 World Series and win it all? Recapping past projections and actual results, in the prior 4 seasons in which projections were made on a statistical basis, the MAAD correctly predicted a World Series participating team in only 2 of 8 instances. However, those 2 instances involved the last 2 World Series so perhaps the analytics staff is sharpening its quantitative methods. Only 1 in 4 times has MAAD predicted the correct World Series winner – in 2022 when it predicted the Twins would win.
This year, MAAD’s ExW methodology is spitting out a Detroit versus Minnesota World Series, with the Twins predicted to win their 3rd MMDBL title. There you go -- this summer's Paper Dragons -- the Tigers and Twins now face the unbearable weight of World Series expectations.
With 90 games to go, anything can happen no matter what the data says. After all, this is baseball. Let the games begin.