Flipped Fortunes: Cincinnati Rising, Detroit Crashing
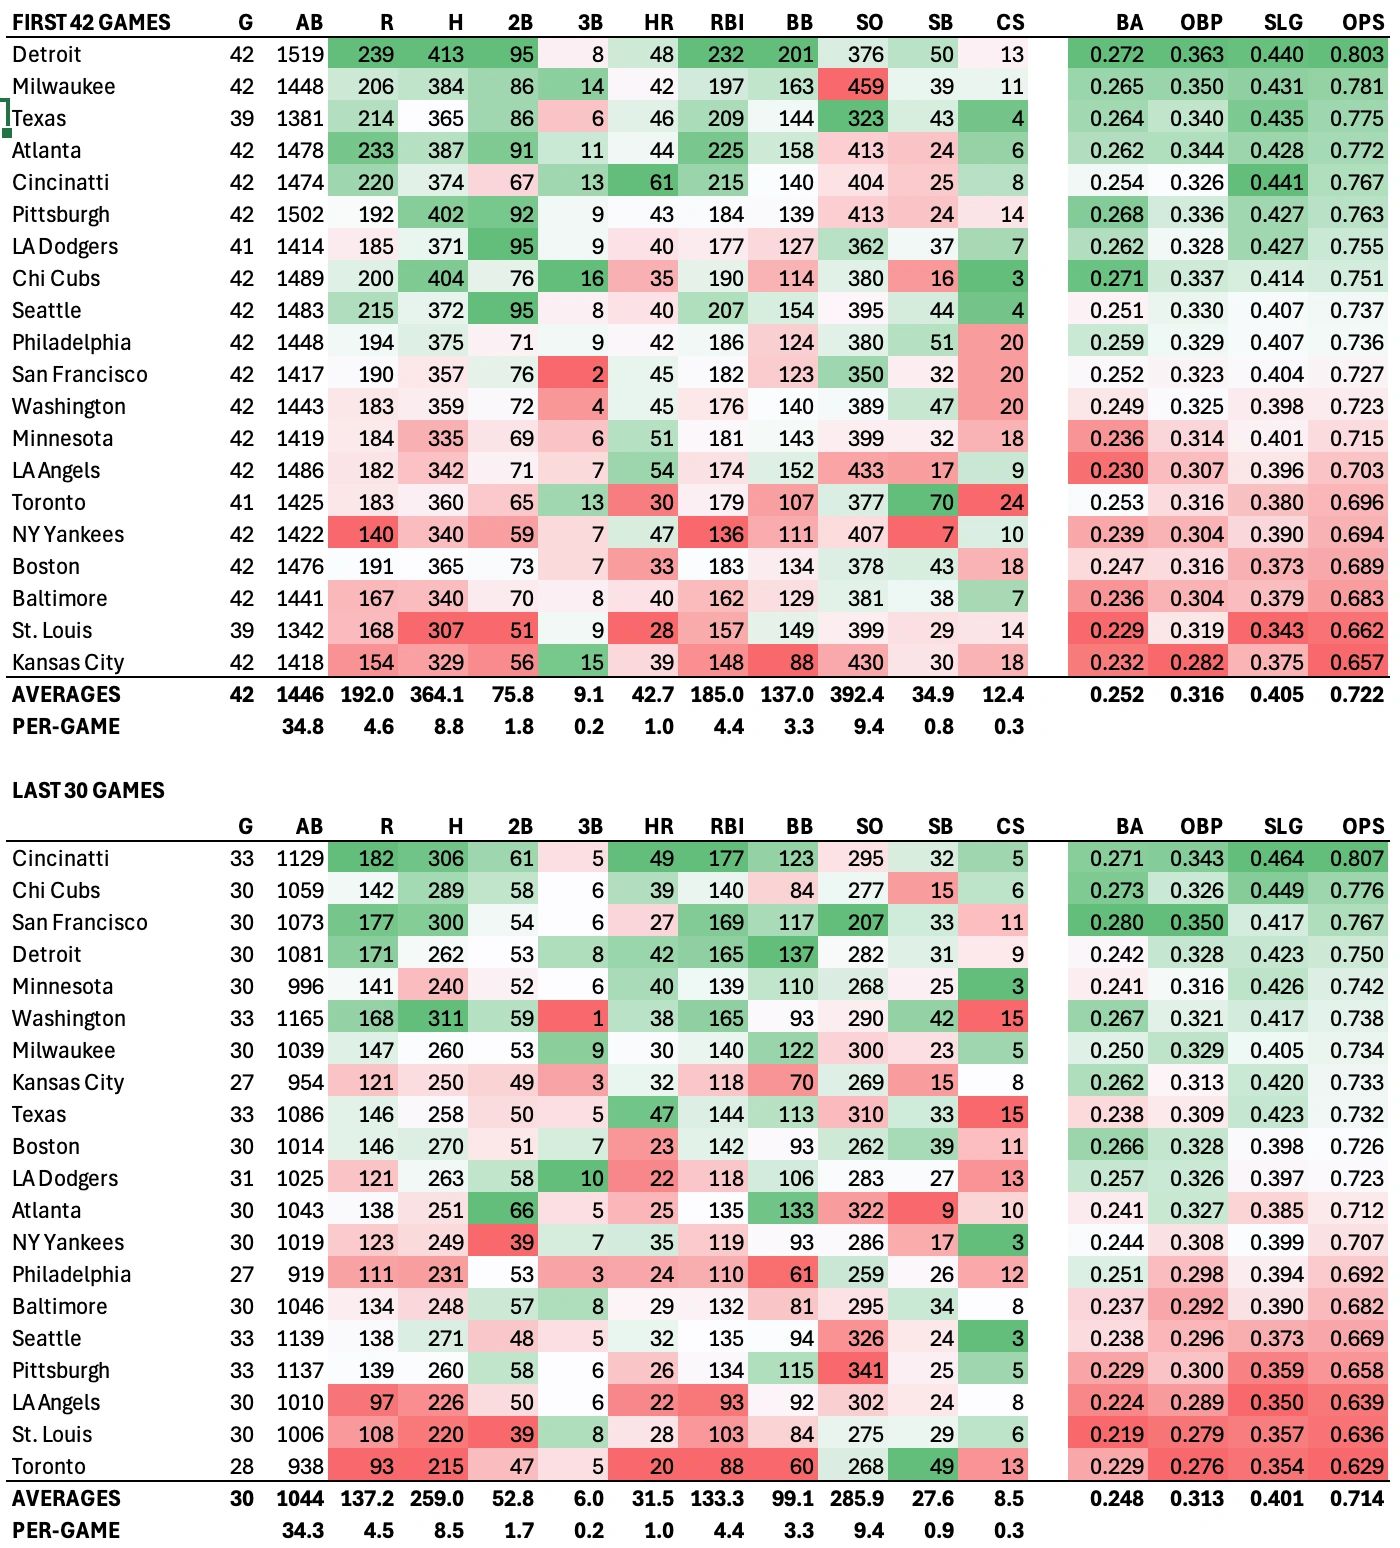
The last 30 games have produced very different results than the first 42 games for many teams, and the flipped fortunes are shaping the playoff race in ways that seemed unlikely before Memorial Day.
So what’s going on? In many instances, it’s a case of teams making key acquisitions that have improved their overall results. For some teams, injuries are playing a role. Then there’s the “that’s baseball” explanation where hot teams suddenly go cold and cold teams suddenly get hot.
Let’s start with the starkest example of flipped fortunes – the Detroit Tigers – posterchild for when it all goes right at once, then suddenly the meme for what it looks like when it all goes wrong at the same time. The Tigers set an MMDBL record with the best 40-game start, shooting out to a 31-9 record. At the 42-game mark on May 17, the club stood at 32-10 and seemed to be on pace for a single-season win record and the No. 1 overall seed in the Bull Durham. The Tigers are now 45-27 after 72 games, which computes to a 13-17 stretch over the last 30 games, including a current 5-game losing.
There have been no injuries, just ineffectiveness. Some regression was expected; the front office baked this expectation into its approach to the trade deadline. While regression was expected, reversal was not. The new acquisitions have performed worse than the players they replaced, so maybe it’s a case of trades undermining team chemistry.
Detroit’s potent offense has slipped a bit in the last 30 games but is still formidable over that time. What’s happened to the pitching, on the other hand, can only be described as an outright implosion. In the 30-game stretch, the team has trailed 4-0 or worse 14 times! And 5-run leads are not safe, as was exhibited last week when Griffin Jax and Emmanuel Clase combined to blow a 9-3 lead in the 6th inning in a game eventually lost to the Red Sox.
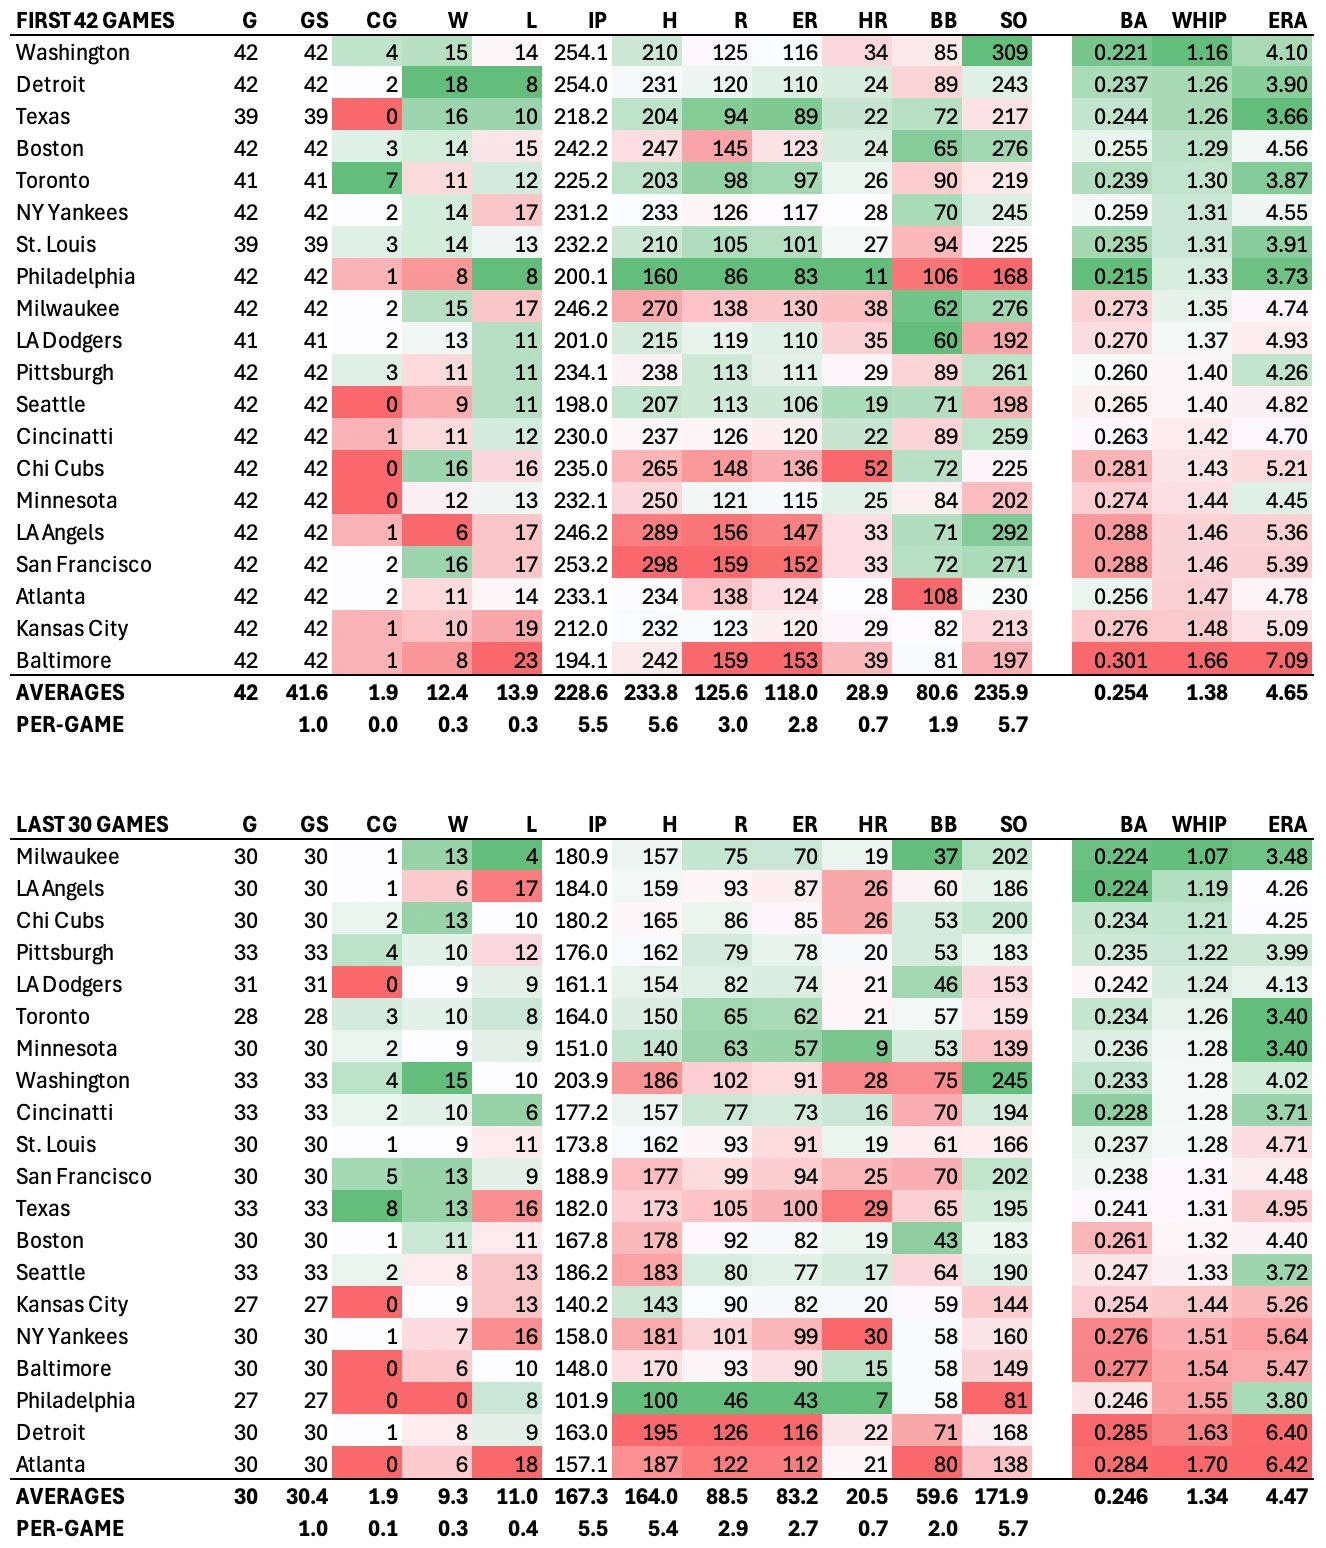
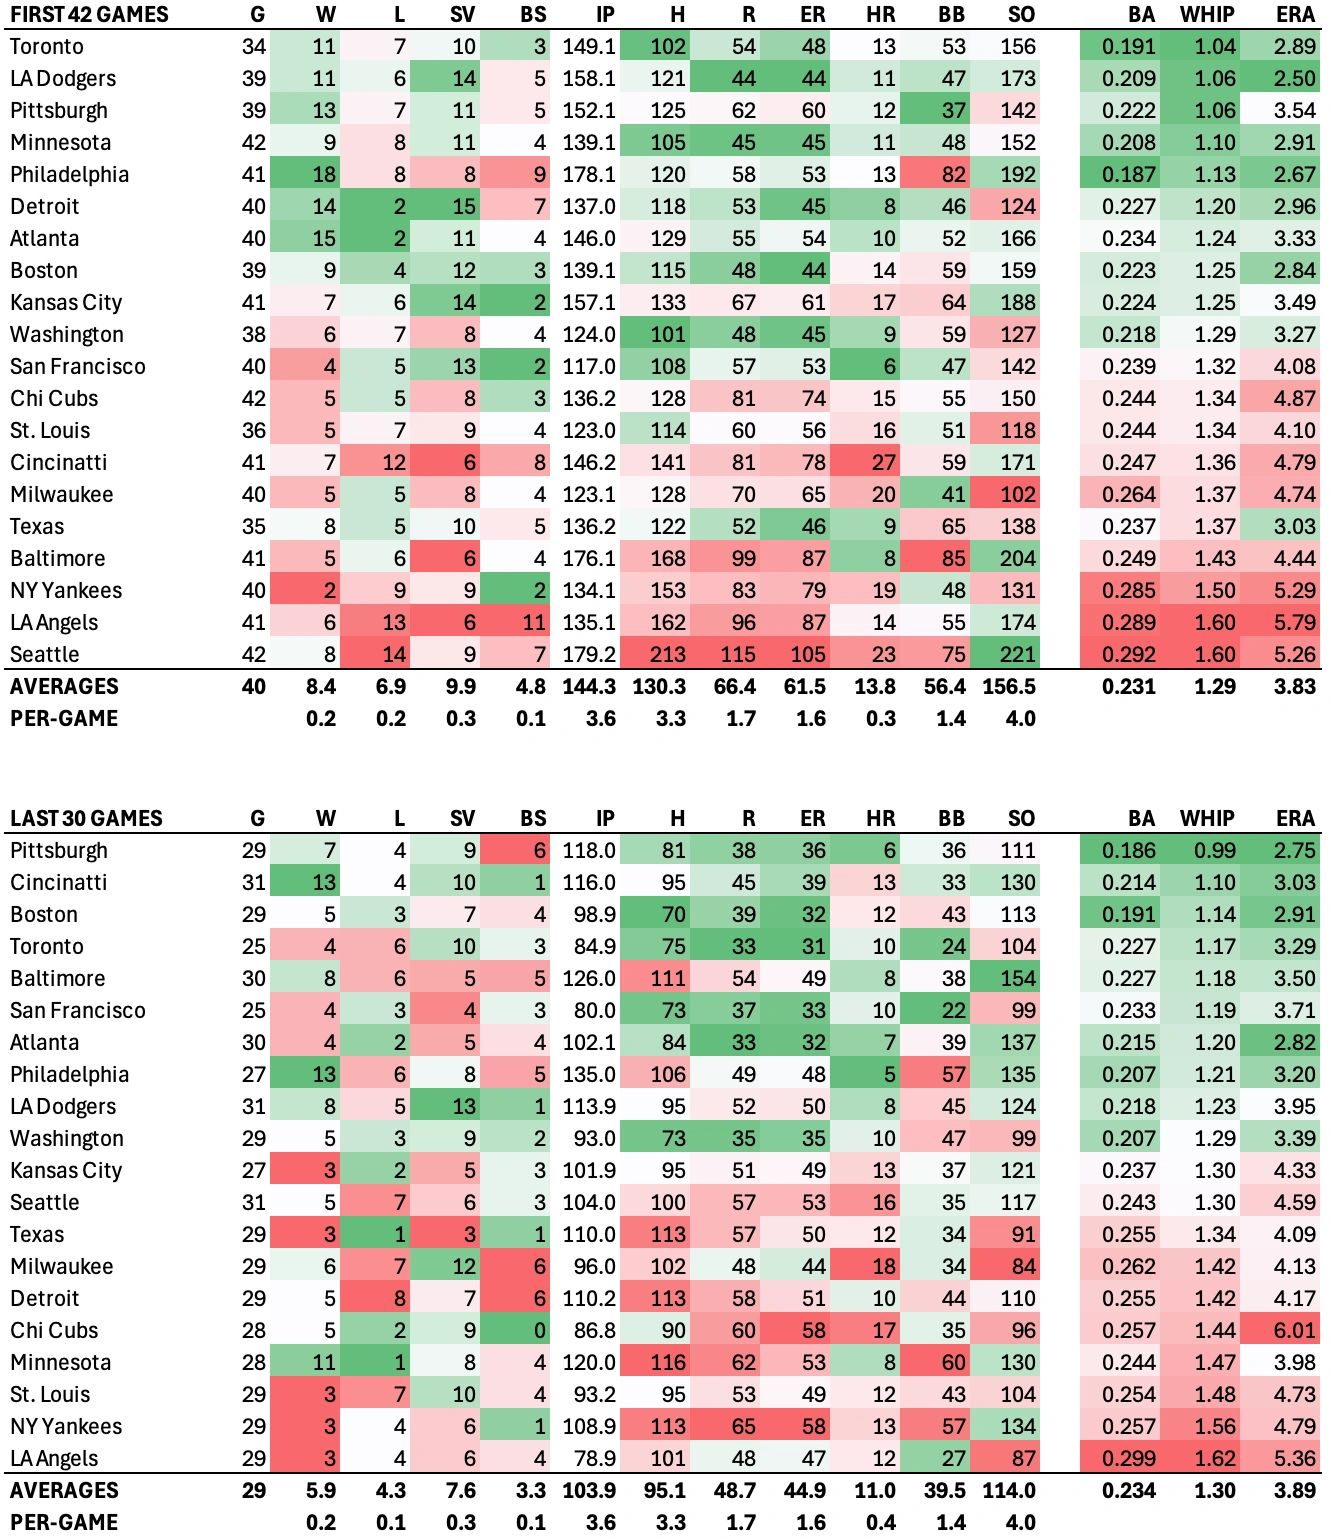
Tigers’ starters are yielding a league-worst .285 batting average in the last 30 games and have seen the biggest increases in opponent batting average (OBA), WHIP and ERA in that time frame relative to the first 42 games. In the last 30 games, Tigers’ starters are yielding a batting average that is 48 points higher, a WHIP that is 37 points higher, and an ERA that is 2.50 runs greater than the team posted in the first 42 games. The Tigers’ bullpen is tracking right along with the starters, up a second-worst 28 points in OBA, 22 points in WHIP, and 1.21 in earned runs allowed.
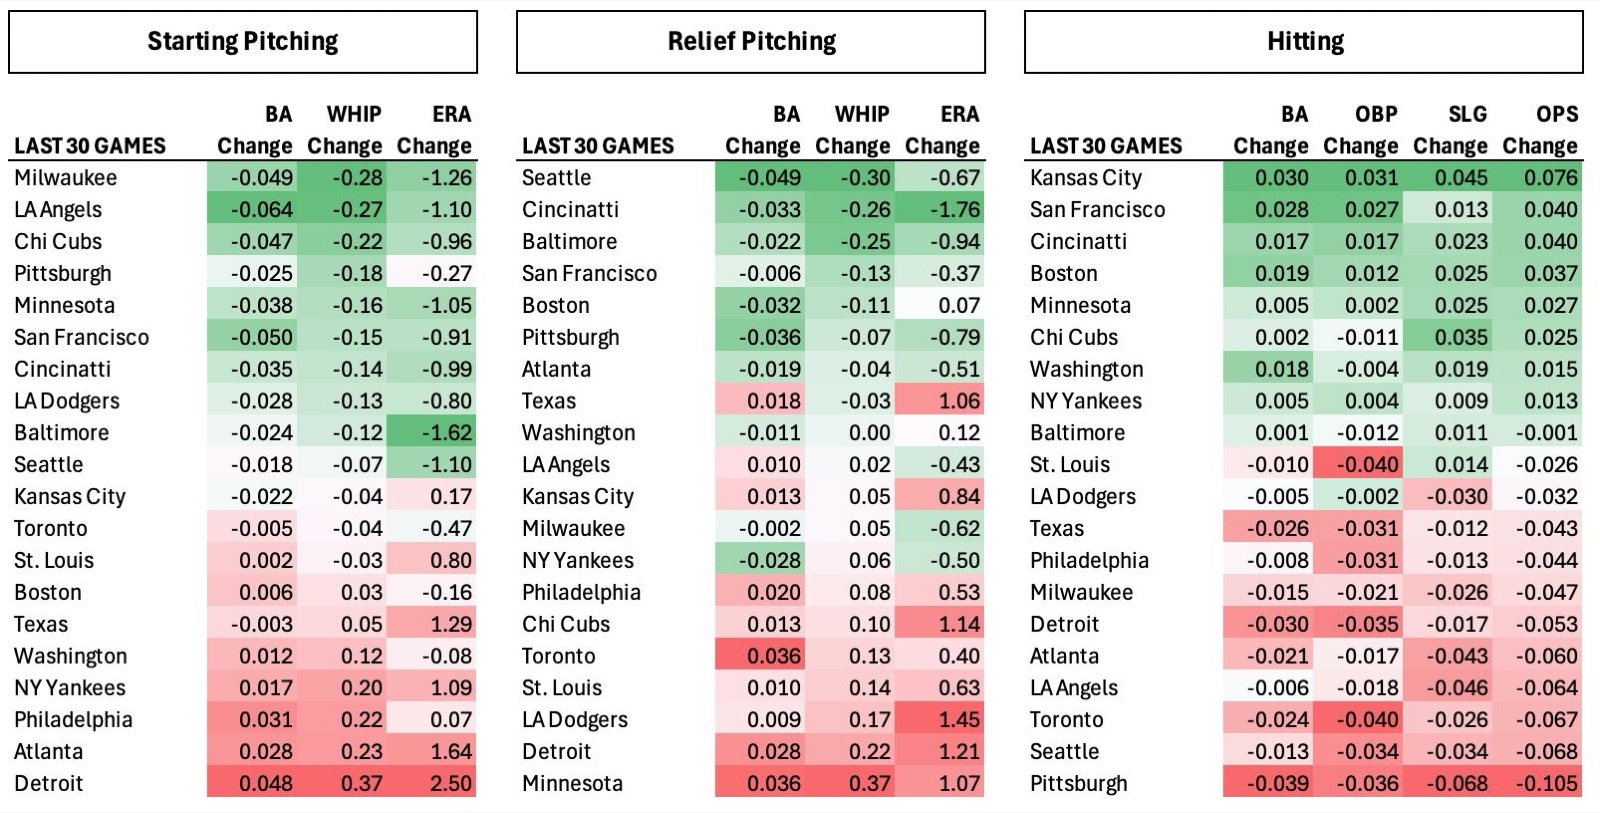
While the Tigers’ hitting over the last 30 games is still Top 5 (ranked by OPS), its slippage is also notable, especially when contextualized with the pitching implosion. In the first 42 games, a bad pitching outing was regularly overcome with explosive offensive output. Now, it seems, all oars are out of the water and the canoe is taking on water. Tigers’ hitters have posted a second-worst 30-point drop in batting average, a third-worst 40-point in OBP, and a 6th-worst drop in OPS (53 points).
Red Flag Day
Of teams still vying for playoff spots, other than Detroit, only Texas and Philadelphia have seen an increase in starter and reliever ERA and a drop in hitting OPS over the last 30 games. When these three things go bad at once, it’s a red flag day. This has certainly been the case for the Rangers. They were in second in the Bull Durham at the 42-game mark, and while they remain in second place they’ve only shaved 2 games off the Tigers’ lead, cutting it to 5, and have enabled a stable of 6 competitors to close within 2.5 games of them, including Boston, Chicago and Milwaukee which are only 1 game back. Their regression to a 15-15 mark over the last 30 games was partially fueled by injuries which cost them a chance to capitalize fully on the Tigers’ woes.
Philadelphia has also seen a closing of the ranks. In first place much of the early season with Atlanta, they’ve relinquished the lead to the Pirates, Dodgers, and Twins in recent weeks. And if the race in the Bull Durham is close, the race in the Natural is cramped with 6 teams within 1.5 games of first place and Atlanta another 3.5 games back. Phillies’ starters have regressed modestly in terms of ERA (7-point increase) and are third-worst overall in the last 30 games (ahead of Atlanta and Detroit) in terms of WHIP (1.55). For context, starters are historically supporting actors in Philadelphia’s story, ceding the leading role to the bullpen. The leading actor, however, has yielded 0.53 more earned runs per game in the last 30 games, though Philadelphia’s bullpen remains a Top 8 unit in terms of WHIP. Meanwhile, the club’s hitting has regressed with an OPS that is 44 points lower over the last 30 games.
The Rangers’ starters have posted a third-worst 1.29 increase in ERA over the last 30 games, and its bullpen has added a 5th-worst 1.06 increase in ERA to the fire. Hitting-wise, the Rangers posted a 26-point drop in batting average, 31-point drop in OPS and 43-point drop in OPS over the last 30 games. After posting Top 3 results in starting pitching (WHIP) and hitting (OPS) in the first 42 games, Texas’ starters and hitters have regressed to middle-of-the-pack performers.
If you’re looking for categorical worsts, well, we already established that the Tigers have experienced the biggest decline in starting pitching performance over the last 30 games, but we’d be remiss if we didn’t highlight the massive regression of the Braves’ rotation. The Braves’ starters in the last 30 games yielded a second-worst 23-point increase in WHIP and second-worst 1.64 more earned runs per game. In fact, Atlanta’s rotation has a league-worst 6.42 ERA in the last 30 games, just ahead of Detroit’s bulging 6.40 ERA. Overall, Atlanta’s slippage has been the most costly. Tied with the Phillies for first place in the Natural at 26-26 on May 17, the Braves are just 10-20 since and are falling out of the playoff picture. If the season ended today, they’d be the odd man out.
For relief, it is somewhat surprising to see the Minnesota Twins take the prize. Overall, the Twins have been the opposite of the Braves – going 20-10 in their last 30 games to claw back into playoff contention. No thanks to the bullpen, however. The Twins’ bullpen over the last 30 games has been unstable at best, yielding a league-worst 36-point increase in OBA and 37-point increase in WHIP, and 1.07 increase in ERA. Offsetting the bullpen woes, however, is improved starting pitching and greatly improved hitting (5thmost improved in terms of OPS), which has been the key to the Twins surge. Another rising competitor in the Natural, the Dodgers, posted a bullpen ERA in the last 30 games that is a league-worst 1.45 runs per game more than its ERA over the first 42 games. However, it hasn’t derailed their quest for the playoffs.
Among playoff contenders, Pittsburgh has experienced the biggest regression in most hitting categories in the last 30 games. The Pirates have experienced league-worst decreases in batting average (39 points), slugging (68 points), and OPS (a whopping 105 points, from .763 to .658), and a second-worst drop in OBP (36 points). Part of this decline can be attributable to the regular season-ending injury to Mike Trout, though Pittsburgh has unquestionably hit a teamwide rough patch at the plate. Still, the Pirates are in the thick of the Natural playoff race with a cast of teams all exhibiting some recent performance flaws (please reference commentary on Atlanta, Los Angeles, Minnesota and Philadelphia above.)
Reversal to Good Fortune
So who’s not experiencing recent performance flaws? That would be Cincinnati, the helium choice to win the Natural. The Reds are on a 23-10 run, in the midst of a 7-game winning streak, and are the hottest team in the MMDBL. Cincinnati’s recent surge can be partly attributable to trade acquisitions – perhaps mostly. In the first 42 games, the Reds were bottom half in both starting and relief pitching (based on WHIP). In the last 30 games, the Reds are second in relief with a 1.10 WHIP (behind Pittsburgh, 0.99 WHIP), and starters are 9th in WHIP (1.28). Cincinnati’s hitting has gone from good to best. In the first 42 games, the Reds had a 5th-best .767 OPS and league-leading 61 homers. Since, they lead the league in both categories with a .807 OPS and 49 more homers and are the overall leader in most offensive categories through 72 games, including homers (110), slugging (.451) and OPS (.787).
For the Reds, it all adds up to a reversal of fortunes. In the last 30 games, the Reds’ rotation and bullpen have posted ERAs that are 0.99 and 1.76 runs lower, respectively, than they did in the first 42 games. The already good hitting has posted a second-best 40-point increase in OPS in the last 30 games.
Aside from the Reds, only one other playoff-contending team improved its bullpen and starter ERAs and its hitting OPS in the last 30 games – San Francisco. The Giants traded off, seemingly exiting themselves from the playoff race, and yet here they are in the thick of it. The reasons are rotation and bullpen ERAs that are 0.91 and 0.37 runs better, and an OPS that is a second-best 40 points higher, in the last 30 games. Slugging is up modestly; the higher OPS is due to second-best increases in batting average (28 points) and OBP (27 points).
Milwaukee is a good news story, as well. The Brewers’ starters have the most improvement in WHIP in the last 30 games versus the first 42, down 28 points, while also lowering their OBA 49 points and ERA by 1.26 runs. The bullpen performed about the same in terms of OBA and WHIP in the last 30 games but posted an ERA that is 0.62 runs lower than the first 42 games. Milwaukee’s hitting slipped in the last 30 games but the club is still a top offense in the MMDBL, and the combination of good offense and improving pitching has moved them into contention, going a Bull Durham-best 19-11 over the last 30 games.
Finish Line Ahead
With 18 games left, momentum (or lack thereof it) could play a factor. If the teams that have clicked in the last 30 games keep it up, then the playoffs will look materially different than they would have looked had the season ended May 17. However, if the regressors stop their free fall and normalize, perhaps they anchor a playoff spot for themselves.
If you’re Detroit, Texas or Philadelphia, you’re probably asking, “what type of team are we really?” The wide swings in outcomes can cause front offices to wonder if their quick starts were a mirage, or if their most recent stretches are just a perfect confluence of bad circumstances.
Fortunes can change in 18 games, too, especially if its “that’s baseball” doing what it does best. GMs will believe the math, trust over-corrections will re-correct again, and expect the unexpected. With 14 teams now within just 3.5 games of a playoff spot, this is shaping up to be a regular season for the ages.
STARTERS
RELIEVERS
HITTERS