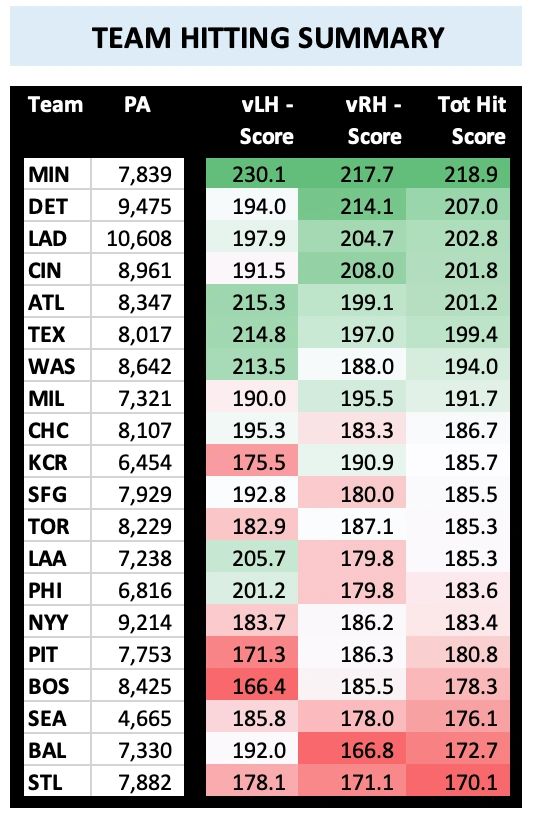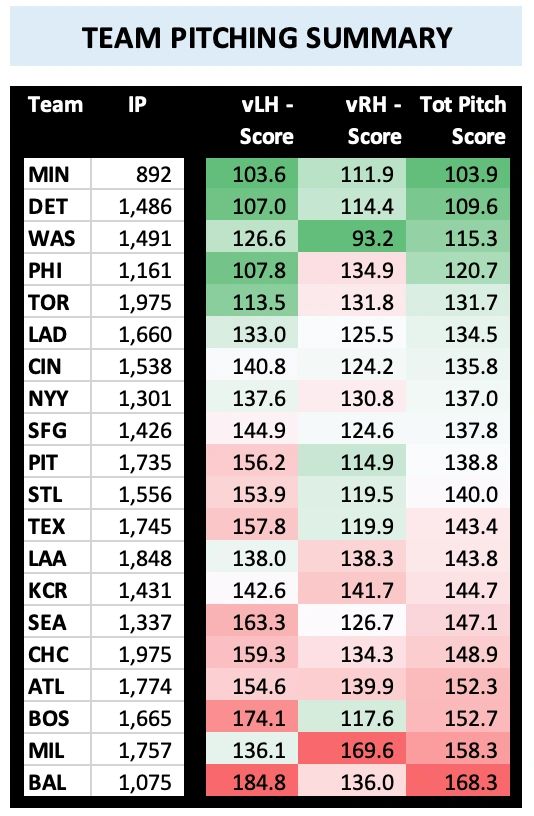
How the Deadline Deals Impact the Regular Season Projections
The fun (and folly) of data is that it enables statistical-based projections. In the MMDBL, this fun (and folly) has been reasonably good at projecting the playoff teams from each division through the years.
This year, however, not so good.

The bottom 4 teams in the Bull Durham Division's preseason prognostication are all in the mix for a playoff spot, and the top team (San Francisco) has traded off and is clinging to the bottom-rung of playoff contention. In the Natural Division, the bottom team in the preseason projection -- Pittsburgh -- is in first place! Five of the top 6 in the projections are squarely in the thick of it, however.
Every year there are teams that get off to slow starts and trade out of contention (this year, that would be the Angels, Giants and Mariners, to name a few); and some teams get off to fast starts and trade deeper into contention (see the Red Sox, Cubs, and the Braves.) Depending on how early these decisions are made can significantly impact how clairvoyant the pre-season projections appear to be.
The dust settles at the trade deadline (Game 58) which is why the MMDBL Advanced Analytics Department (MAAD) recasts its projections based on the new composition of each team's 40-man roster and then prorates that new projection over the remainder of the season, adding each team's revised Expected Wins (ExW) to its actual wins to derive its new final projection. With two-thirds of the season in the books, even a team that has dramatically improved its roster may only be talking about 3-5 extra wins over the last 30 games. Instead of going 17-13, that team might go 21-9, but that could make the difference. A contending team's trade acquisitions may not necessarily change its seeding dramatically as the regular season winds down, however, those newly acquired players could significantly impact the playoffs where every decision and every matchup matters.
Feel free to read past projection blogs (February 2025, June 2024, February 2024) to better understand the MAAD forecasting methodology, but we'll sum it up here:
- Based on actual card values, weighted based on MLB playing time (plate appearances for hitters, batters faced for pitchers) for entire 40-man MMDBL roster
- Based on Bill James' Pythagorean Win Expectation Formula, but many modifications to that formula
- For hitters, getting on base and delivering extra-base hits drive value
- For pitchers, preventing baserunners and avoiding the big hit drive value
- Defense, base running, stealing and other intangible metrics (e.g., pitchers' hold, fielders' arm, etc.) are not considered in the formula but a post-formula +/- adjustment was introduced in February 2025 calculations
- Team hitting and pitching scores are produced versus lefties and versus righties, and a total team hit and pitch score is derived based on lefty-righty matchup probability
- Total Team Score is "Total Hit Score" minus (-) "Total Pitch Score", and the Total Team Score is applied to an Expected Wins (ExW) table to determine each team's ExW projection
- The ExW table is bell-curved, softening outlier outcomes such as projecting a team with 60 or more wins or 30 or fewer losses (its still possible, though -- look at Minnesota's post trade-deadline ExW -- 62!)
Teams are prone to seeing the output and saying, "my team's better than that!" Of course it is; you built your team for how you envision managing it, and that's not factored into the MAAD ExW Formula. This is why some teams routinely outperform their projections. Additionally, the sum of all teams' ExWs do not compute to an equal expected loss, which is another way of saying that the level of competition is not factored into the equation. If a 55 ExW team is playing 9 games versus other 55 ExW teams, something's gotta give, and that's not a consideration in the formula. (Oddly, though, the sum of all teams' ExWs is 901, just 1 more than the maximum number of wins available to teams to earn in the regular season.)
So who won the trade deadline? The question should actually be reframed as, "which team's ExW rose the most since the pre-season?" This will account for all additions and subtractions -- yes, there is addition by subtraction since the formula incorporates results based on actual MLB playing time -- since before Game 1. In the Bull Durham, the Cubs, who acquired Ketel Marte and Mark Vientos to upgrade one of the league's most potent offenses, saw their ExW increase +5. Detroit and Boston are both +3 and the Rangers are +1. In the Natural, 3 teams -- the Twins, Dodgers and Reds -- saw their ExW increase +4. The Braves saw their ExW increase +3.
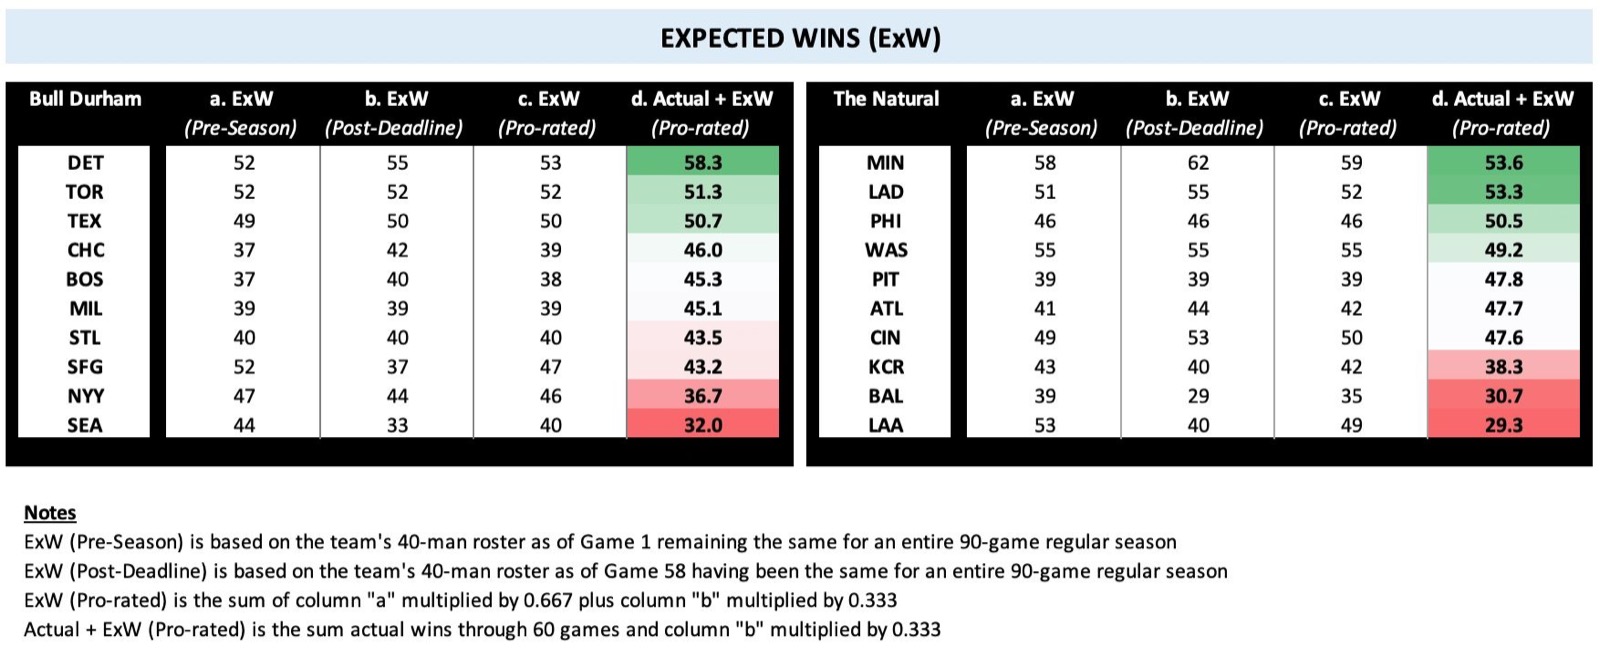
With two-thirds of the regular season in the books and one-third to go, the top 2 teams now in actual+projected ExW are Detroit (58) and Minnesota (54). This implies and 18-12 finish for the Tigers and a 21-9 finish for the Twins. The playoff teams in the Bull Durham project to be Detroit, Toronto, Texas, the Cubs, Boston and Milwaukee. In the Natural, the top 6 project to be Minnesota, the Dodgers, Philadelphia, Washington, Pittsburgh, and Atlanta (with retooled Cincinnati just missing). This projection does not consider remaining strength of schedule and injuries, which can play a big part in deciding how it all sorts out.