Hope Springs Eternal ... Until Expectations Aren’t Met
Buddha once said, “Don’t blame people for disappointing you. Blame yourself for expecting too much from them.” And yet there’s another quote about expectations: “Low expectations are the key to happiness.”
Find me a person who believes these quotes and I’ll find you a person who’s not a baseball GM or manager. If there’s one truism about baseball, it is that hope springs eternal. And hope, of course, is based on expectations.

Since hope effectively sprang 12 weeks ago when the MMDBL season started, now is a good time to evaluate how each team is meeting, exceeding, or falling short of expectations. We once again tasked the MMDBL Advanced Analytics Department with a two-part analytical challenge focused on offensive output. The first part is to come up with a methodology to numerically quantify each team’s expectations for performance. The second part is to evaluate, based on results through 36 games, how each team is doing in terms of meeting those expectations.
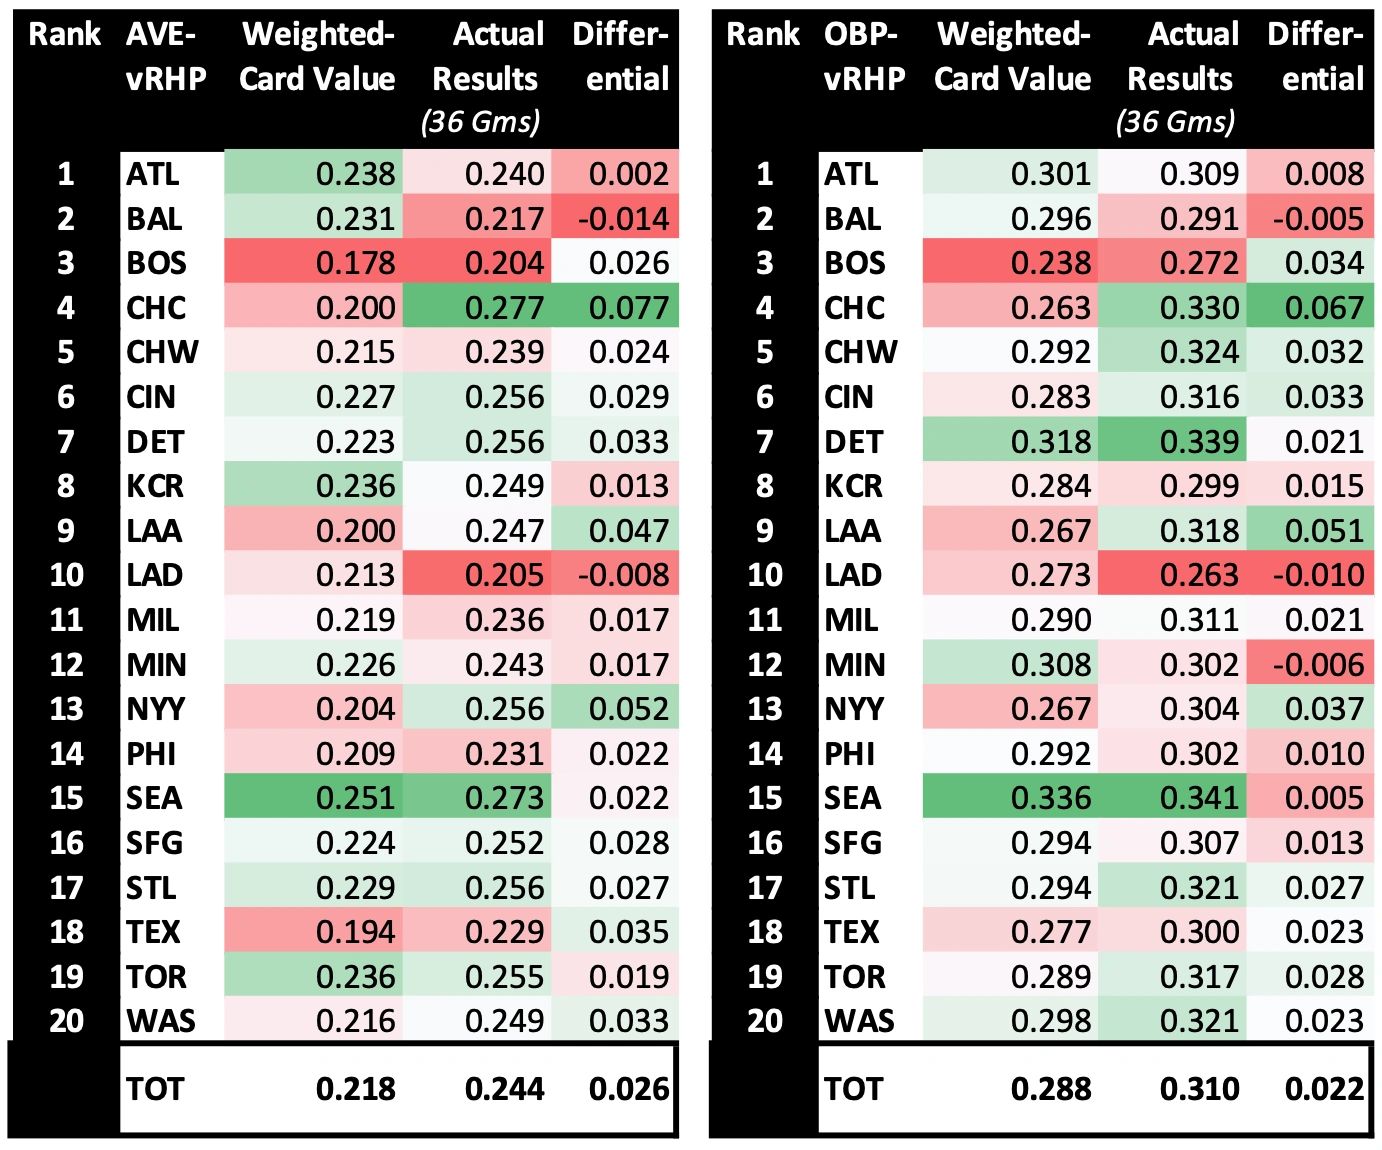
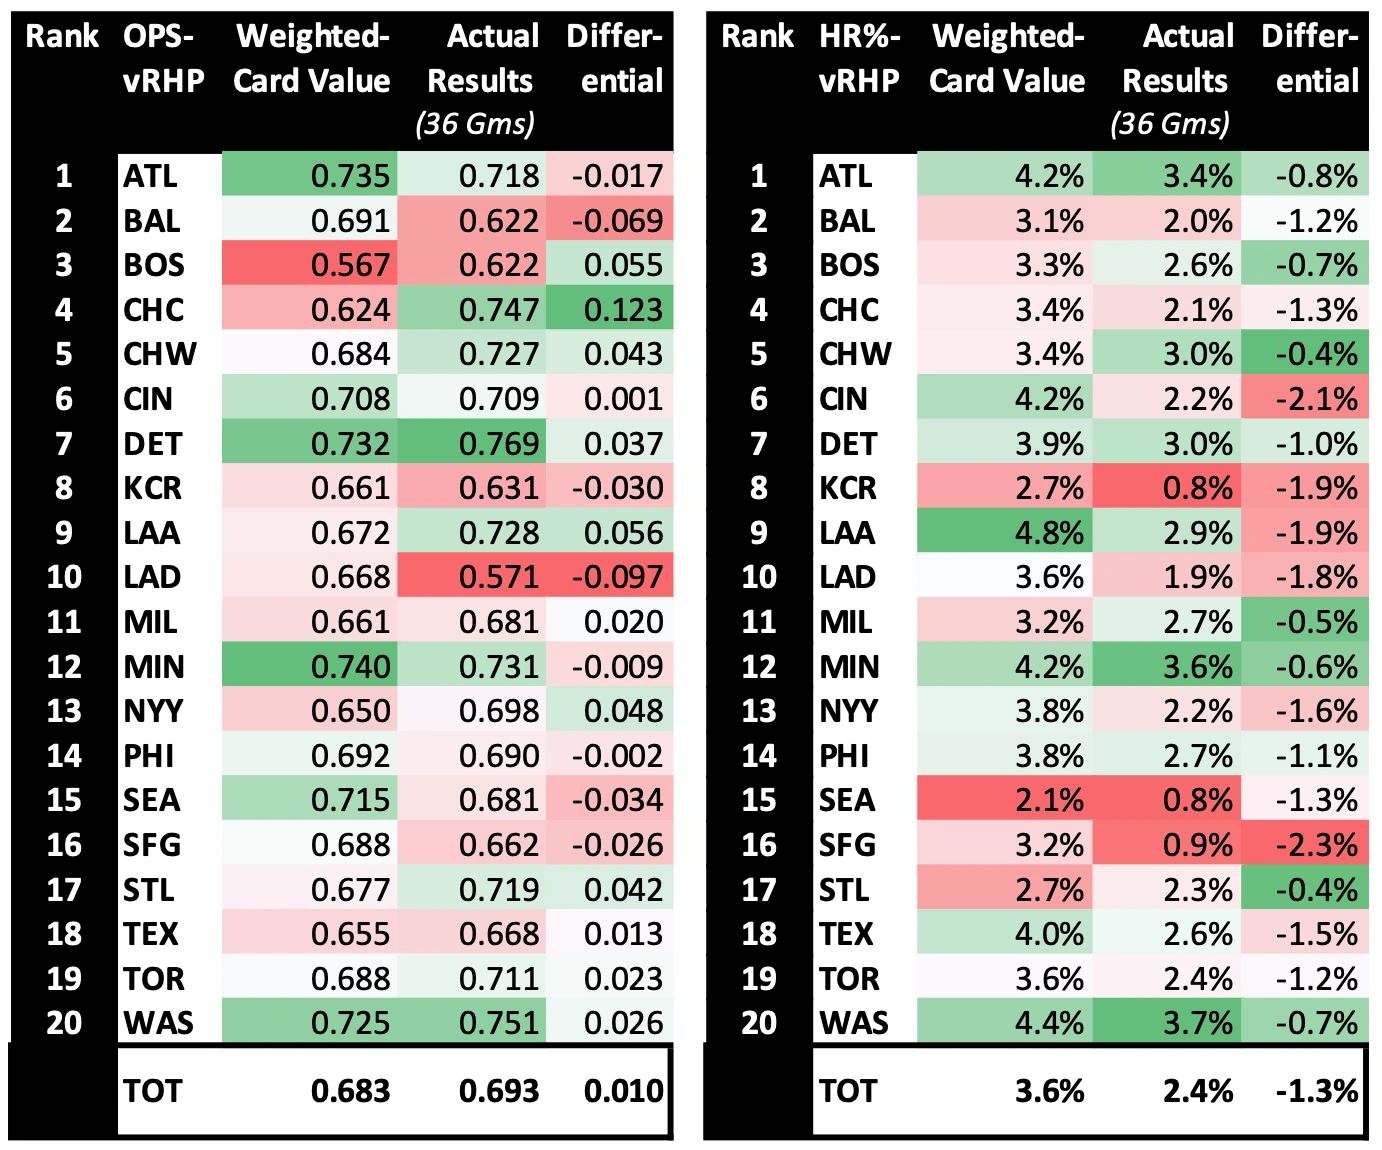
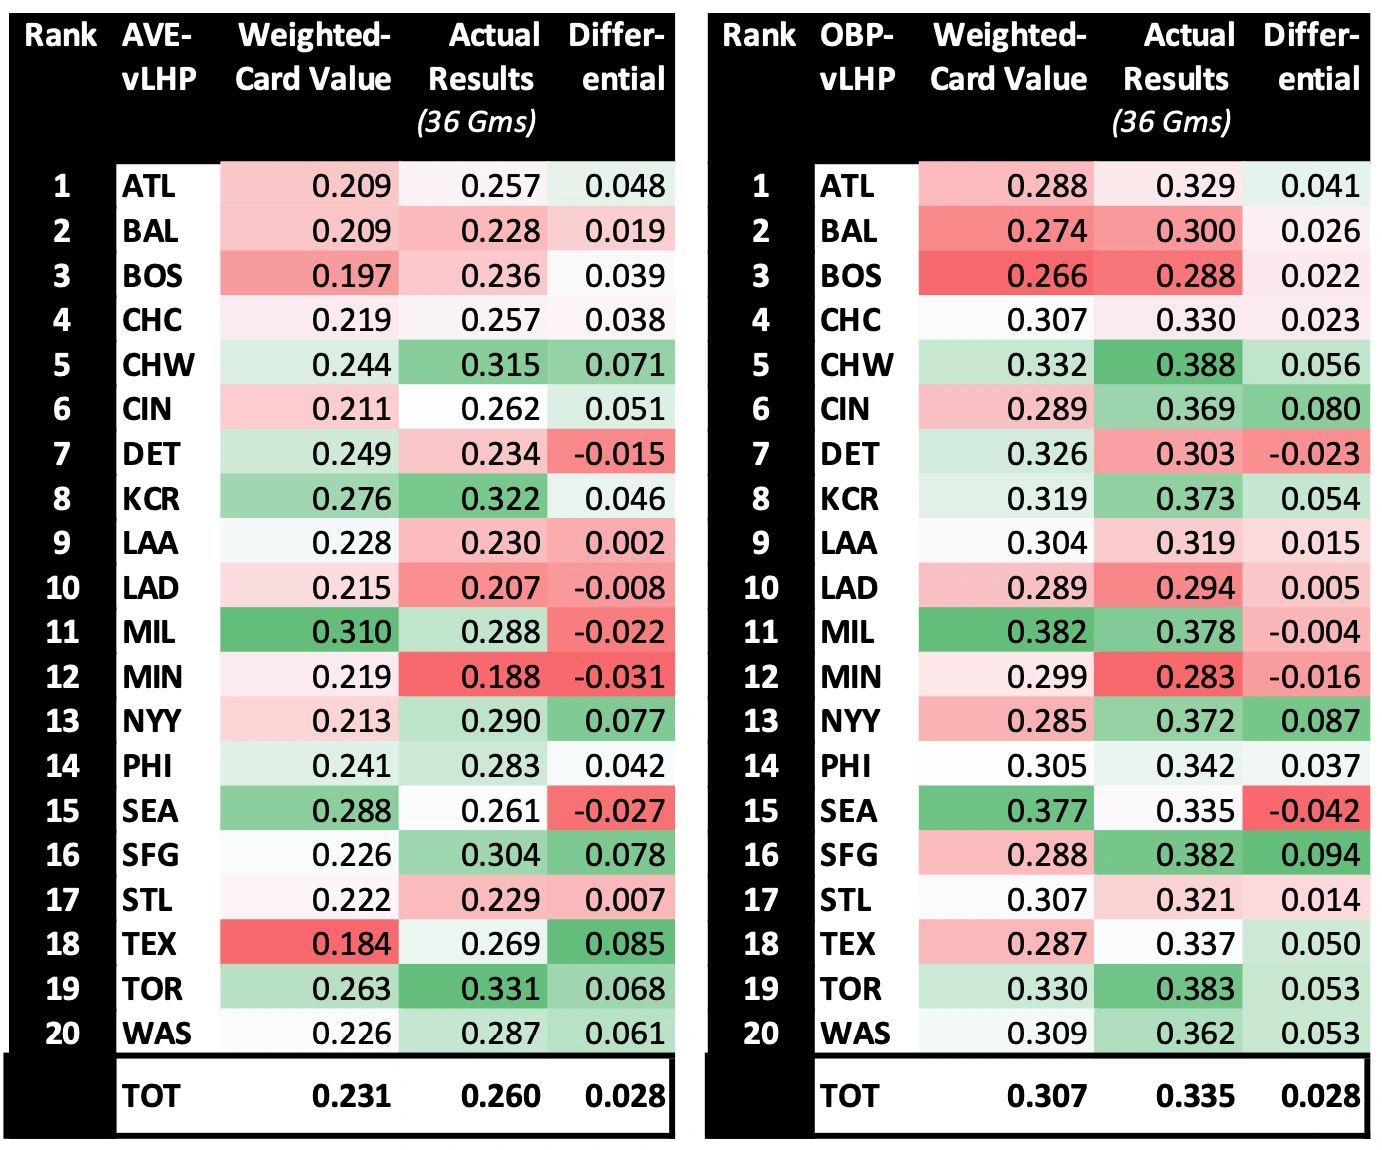
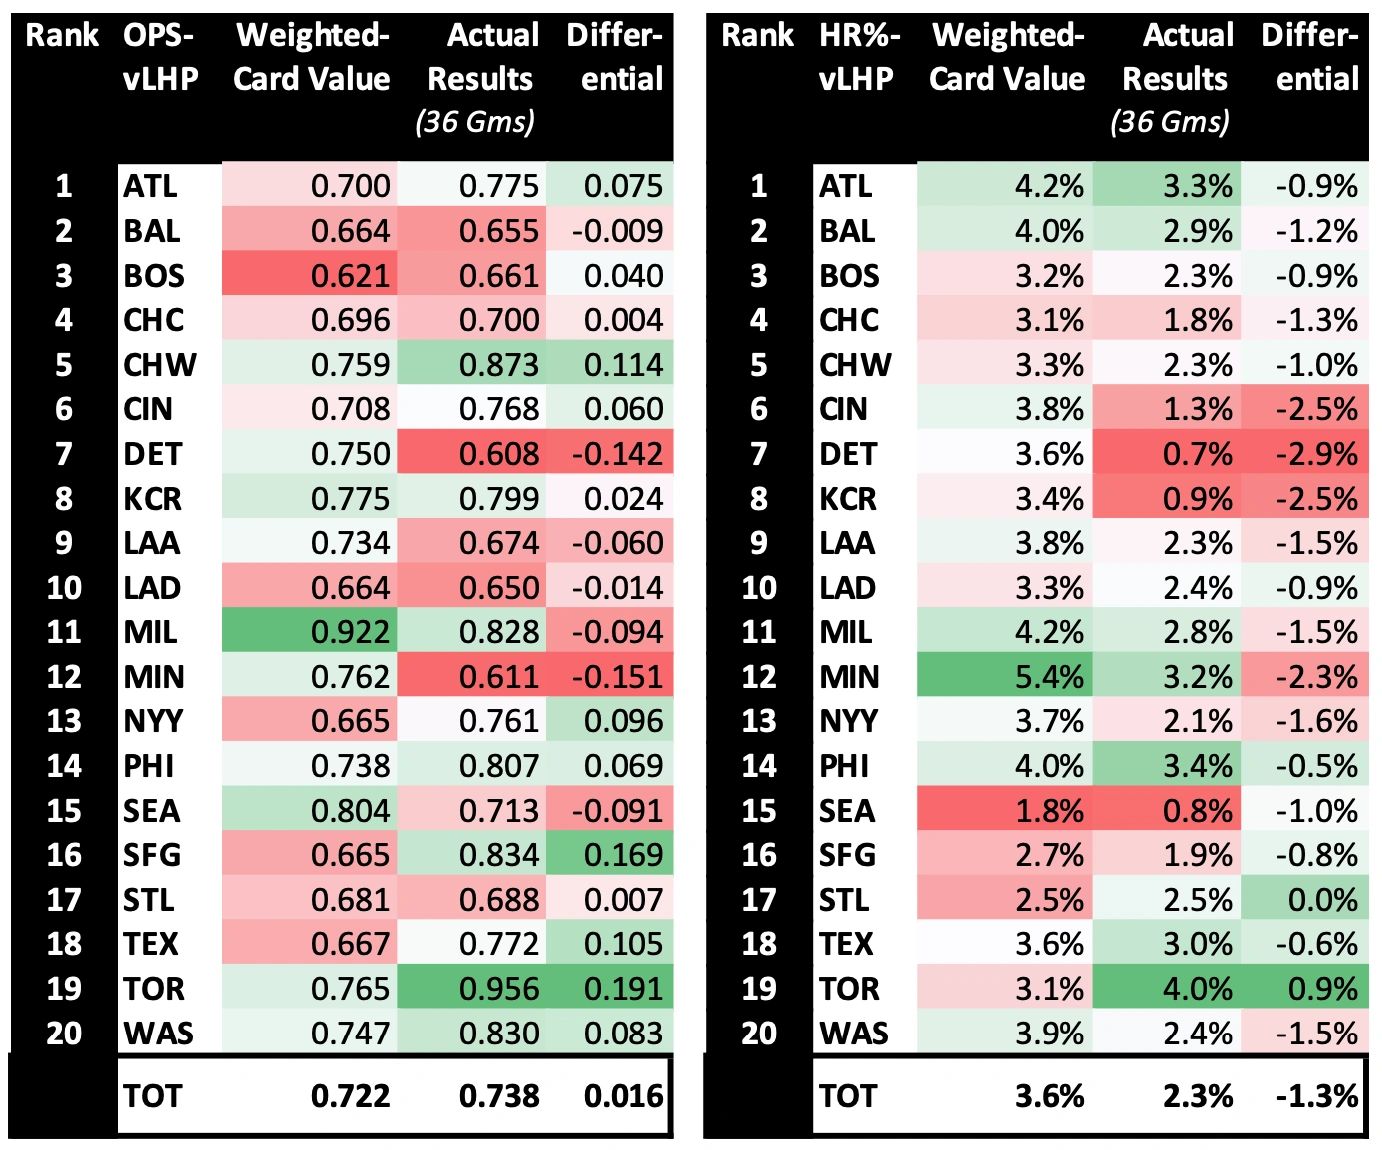
The expectations were broken into two groupings – versus lefties and versus righties. Within each grouping, we established benchmark expectations for batting average (AVE), on-base percentage (OBP), on-base plus slugging percentage (OPS) and homeruns. To establish each team’s expectations, we calculated the weighted-card value for each category. The weighted-card value is just that – the probability for each batter in each of the four (4) categories weighted according their percentage of a team’s aggregate MLB plate appearances for the 2022 season, which is the basis for the MMDBL’s 2023 season. Those weighted values are then summed to produce a team's expected AVE, OBP, OPS and home run percentage versus lefties and versus righties, based solely on the composition of their hitter cards.
This approach has its flaws. For instance, it doesn’t account for actual player usage. For example, a player in the minors who is rarely used may have 550 plate appearances, and an often-used player may have 150 plate appearances, yet the player with more plate appearances will be more highly weighted in the analysis.
Another flaw is that it doesn’t take into account externalities that may impact outcomes. For example, weather and wind effects, the quality of the opposing pitcher, and ballpark differences between where a hitter plays their home games in the MMDBL versus the MLB are either not consider or not controlled.
So what is it we’re trying to measure? Basically, we’re trying to measure what a team’s expectations should have been entering the 2023 season, versus lefties and versus righties, and how that team has performed so far relative to those expectations.
Initial Observations
In our last T.W.I.B. we discussed the league-wide power outage that has the MMDBL on pace to set a record-low benchmark for runs scored per-team per-game. We noted that a lack of homeruns is the culprit as homers are down 22% from 2022 and 36% below expectation. We should note that this analysis looks only at hitter card chances for homers and does not give any credit to Deep Drive results. Nor does it give any credit to range hits or other hits and walks that might come from pitchers’ cards when setting the expectations benchmark (Note: These results, however, are included in the actual 2023 season output analysis.)
One interesting observation is that actual offensive output exceeds the offensive card expectation across AVE, OBP and OPS, and that the degree to which it exceeds expectations is higher against lefties than righties. The differential league-wide in these categories ranges from 0.009 to 0.028. Given that pitcher card results contribute to the actual but not expected outcomes, this differential could be partly explained by the cumulative quality of opposing pitchers faced. But not all of it. Yes, much of the differential may simply come down to Lady Luck.
In presenting the tables, we show three (3) columns:
- Weighted-Card Value
- Actual Results (36 games)
- Differential
The green-white-red shading represents relative ranking within each column. The darker the green, the higher the expectations, the better the results and/or the bigger the positive differential. The darker the red, the lower the expectations, the worse the results, and/or the bigger the negative differential. Whiter shading reflects middle-of-the-pack expectations, performance and/or minimal differential.
The Team-by-Team Tables
Rather than providing some deep analysis on the team-by-team tables, we'll just put them here and let you enjoy. But let’s first discuss our feelings. Those of you who see red in the Differential columns will likely feel some confirmation that Lady Luck has not been with you. Conversely, those of you with a lot of green in the Differential columns may now have some numeric proof that the horseshoe exists and is on your side (or however the saying goes.)
Some of you may be surprised by the “expectations” as established in the Weighted-Card Value columns. And some of you may dismiss those expectations knowing full well that you set your lineups to maximize outcomes and that the weighted-card value methodology doesn’t capture your player usage patterns.
These are all fair feelings to have, but hopefully this analytical exercise generates some thought and perhaps discussion. We considered additional enhancements to the analysis but those changes are currently out of scope for the MMDBL’s under-staffed and under-funded Advanced Analytics Department.
Versus Lefties
Versus Righties