
It Sure is Hard to Score Runs These Days, Right?
If you feel as though it’s tougher to score runs this season, you’re not alone. Scoring is down and managers everywhere appear to be frustrated with their offensive output and once-promising rallies extinguished by empty at-bats.
So what’s going on?

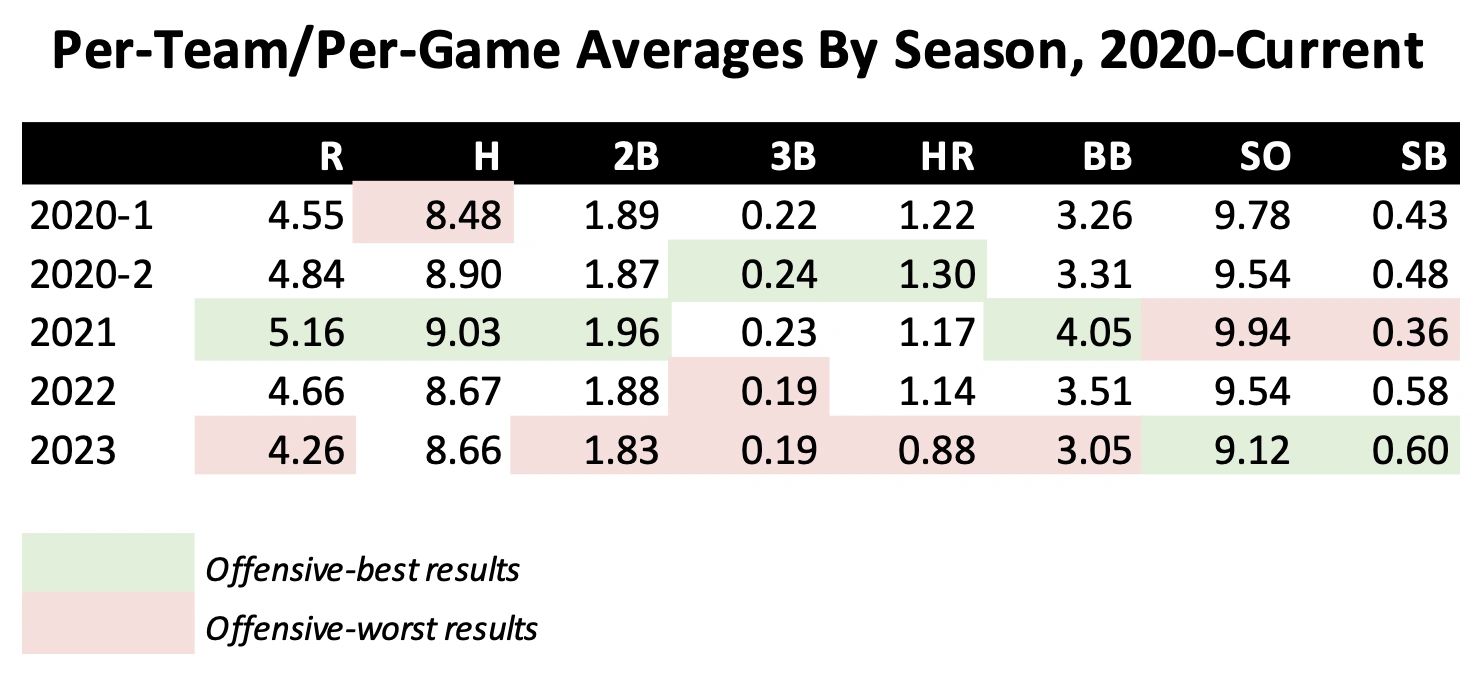
An analysis of hitting statistics from the MMDBL’s five (5) seasons suggests that the culprit is a significant power outage. The league is on pace for its worst-ever season for doubles and triples per-term per-game, but only by a bit. The league, however, is on pace for its worst-ever season for homeruns per-team per-game, and it’s not even close. Homeruns are down 23% year-over-year, and down 33% from their record-setting pace of 2020 Season No. 2.
The result of the power outage is that teams are averaging just 4.26 runs per game, below 2022’s average of 4.66 and well below 2021’s record-setting average of 5.16 runs per-team per-game.
The data also suggests some other 2023 oddities:
- Teams are averaging a record low 3.1 walks per game
- Teams are averaging a record low 9.1 whiffs per game
- Teams are averaging a record high 0.6 steals per game
In the offensive outburst record-setting 2021 season, the opposites occurred – record high walks, record high whiffs, and record low steals.
Versus Lefties, Versus Righties
Something else often heard on game nights: “My lefty starters are getting bombed every time out.” If you have Nestor Cortes or Julio Urias or Carlos Rodon or Clayton Kershaw or Shane McClanahan, “getting bombed” has likely not happened -- at least not "every time out." Though it is worth noting that some of these lefty aces are sporting WHIPs that are 20-40% higher than their actual MLB WHIPs.
If you have lesser non-ace lefties, however, then “getting bombed” may be apropo.
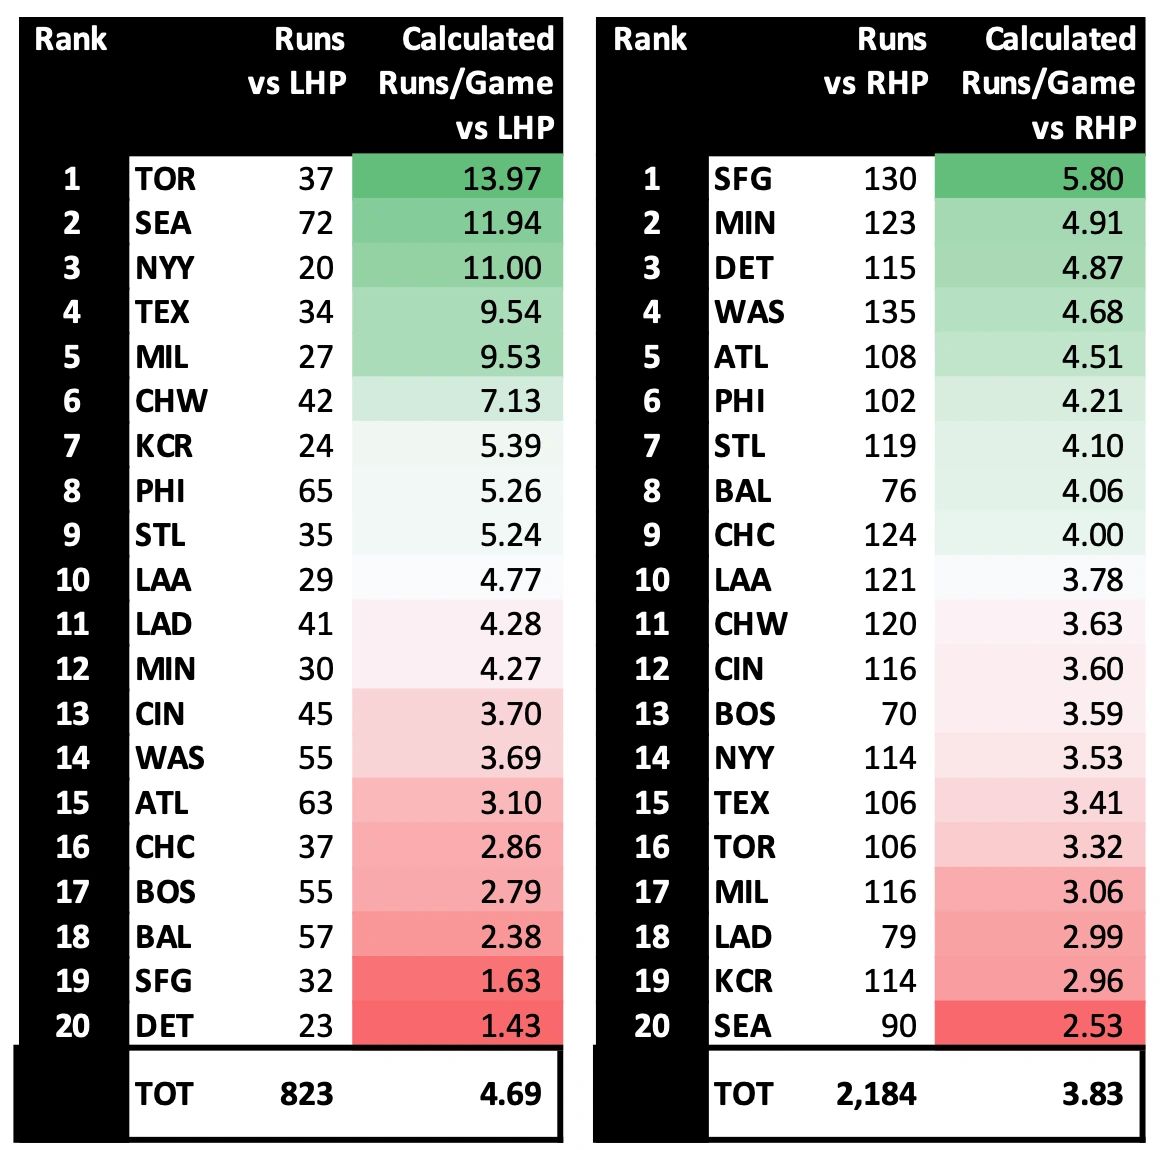
The MMDBL Advanced Analytics Department calculated the implied Runs Scored Average (RSA) versus lefties and versus righties for all 20 teams and, cumulatively, for the league. The analysis, through Game 36, concludes that lefties are yielding an implied RSA of 4.69, or 0.86 higher than the implied RSA for righties of 3.83 (Reminder: the league average is 4.26 runs per-team per-game.)
Toronto, Seattle, the Yankees, Texas and Milwaukee are averaging more than 9.50 runs per-game when facing lefties. They are mashing. Meanwhile, Detroit and San Francisco are averaging less than 2.00 runs per-game versus lefties. You will notice that implied RSAs versus lefties are more volatile than versus righties likely due to the fact that the dataset is smaller. For example, 27% of plate appearances this year have happened against lefties. Case in point: Toronto has had 175 plate appearances versus lefties and 1,063 versus righties.
When it comes to facing righties, the tables turn quite a bit. San Francisco, Minnesota, Detroit, Washington and Atlanta are averaging more than 4.50 runs per-game. Meanwhile, Seattle, Kansas City and the Dodgers are averaging less than 3.00 runs per-game versus righties.
MMDBL Advanced Analytics has also concluded an analysis on performance relative to weighted-card value expectations versus lefties and versus righties. We’ll be sharing this analysis later this week. Spoiler alert: It will show than homeruns are not only down 23% year-over-year, but that they are lagging projected outcomes by 36%!
Yes, the MMDBL is undergoing a power outage that could result in 2023 being a record season for low output in many offensive categories. Covet those runs folks, because they are hard to come by.