With Trades in the Books, What's the Home Stretch Look Like?
With the trade deadline behind us, the MMDBL's Advanced Analytics Department (MAAD) decided to refresh its team analytics and see who improved, who regressed, and who may have a roster advantage in the home-stretch battle for the 12 playoff spots.
Spoiler alert: Some teams definitely got better as a result of trades, but the pre-season favorites to make a playoff run are still the favorites after the trade deadline.

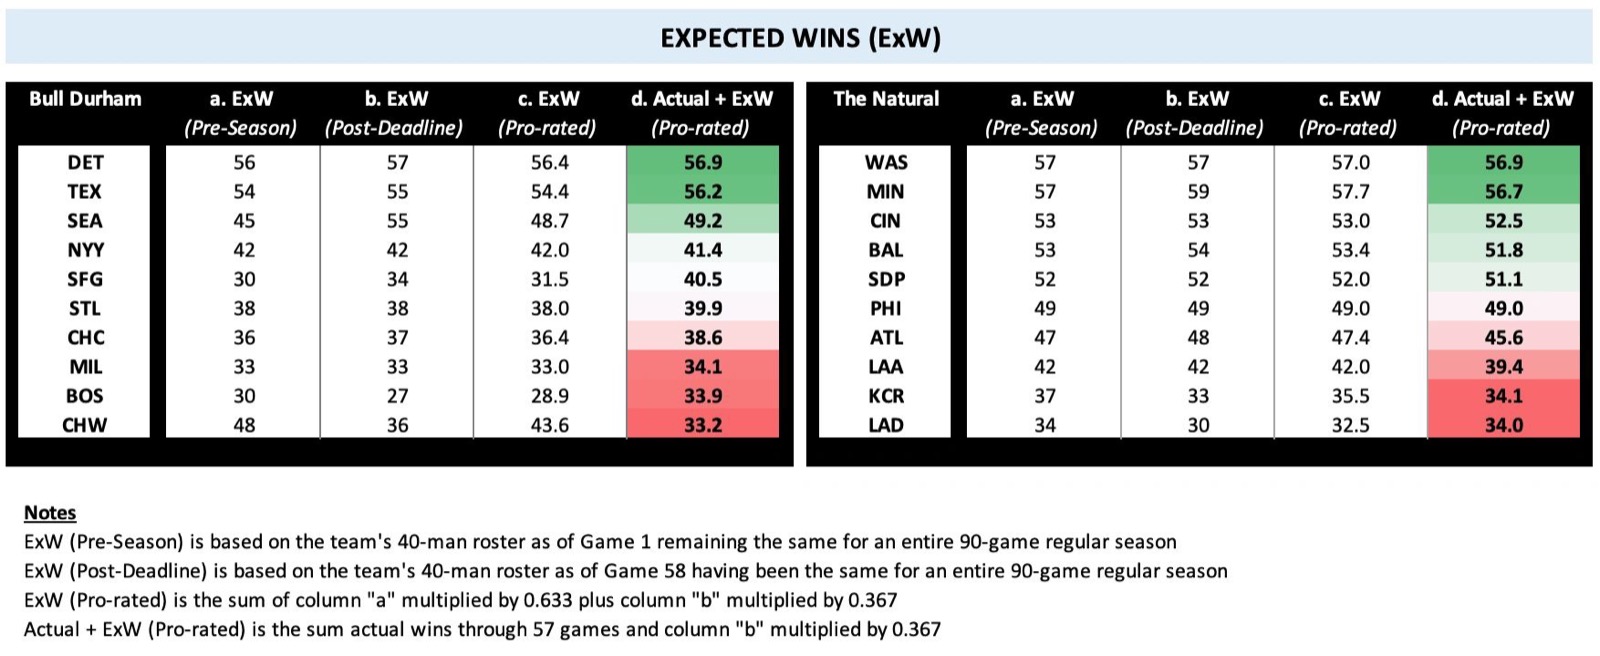
The most improved team is also the team that acquired the most players. The Seattle Mariners improved their Expected Wins (ExW) metric by 10 -- increasing from 45 to 55 -- and is now tied with the 3rd-best ExW. The team acquired Mookie Betts from the White Sox, but another big driver of the ExW increase is the Mariners' revamped pitching staff.
The 2nd-most improved team is the San Francisco Giants, which increased its ExW by 4 wins since the season began. The Giants' improvement happened earlier in the season, instead of at the trade deadline, when they acquired Aaron Nola and David Robertson from the White Sox to bolster their pitching staff, and Brian Reynolds from the Red Sox to anchor their outfield.
The shedding of talent in recent months -- to the likes of the Giants and Mariners -- results in the White Sox seeing the biggest decrease in ExW. MAAD analysis had the White Sox pegged as a 48-win playoff team, but a spate of injuries and an early season swoon quickly changed the outlook for the Southsiders. The Nola/Robertson trade was finalized on March 26 -- 3 months before the June 26 trade deadline -- so the White Sox' redistribution of talent for draft picks began early.
An ExW of 50 or greater indicates that a team has a strong roster, should make the playoffs, and should be a legitimate contender for a successful playoff run barring a spate of bad luck and injuries. MAAD analytics identified 7 such teams in the pre-season: Minnesota, Washington, Detroit, Texas, Cincinnati, Baltimore and San Diego. Following the trade deadline, there are now 8 -- welcome, Seattle, to the 50+ Club.
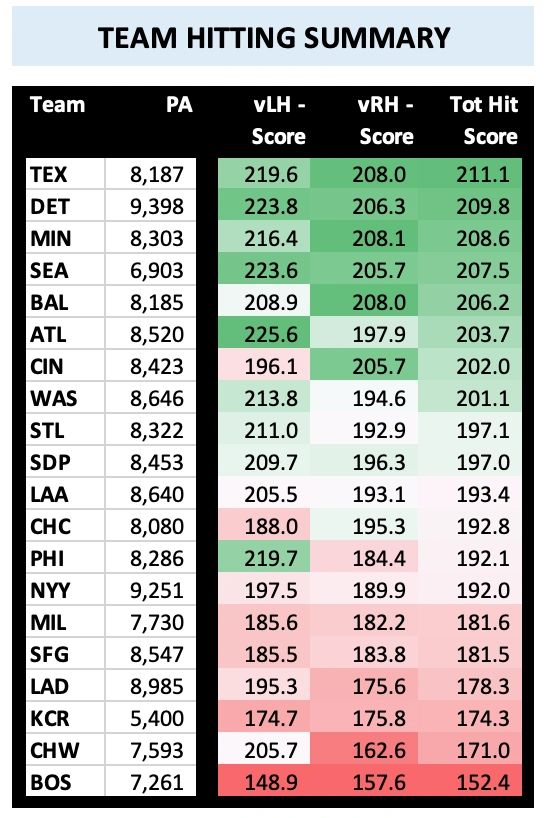
The tables below represent the post-trade deadline revisions. A quick reminder as to what each metric means:
Team Hitting Summary -- Each players' card chances are calculated to produce a "Hit Score" versus lefties and righties. The Hit Score versus lefties and the Hit Score versus righties are multiplied by a factor to produce the Total Hit Score (THS). The multiplicative factor varies if the hitter himself is a righty, lefty or switchy. Scores are largely dependent on on-base and total bases. Positive adjustments are made to each sidedness Hit Score based on factors such as clutch hitting, power, 2-base advance singles, and "bad out" suppression (double plays and strikeouts). Baserunning, stealing, and defense are not considered. The team Total Hit Score is the average of the hitters on its 40-man roster weighted by real-life plate appearances. A higher score is better. The green-white-red scaling is based on an equal distribution between the highest and lowest values and is not pegged to a curve.
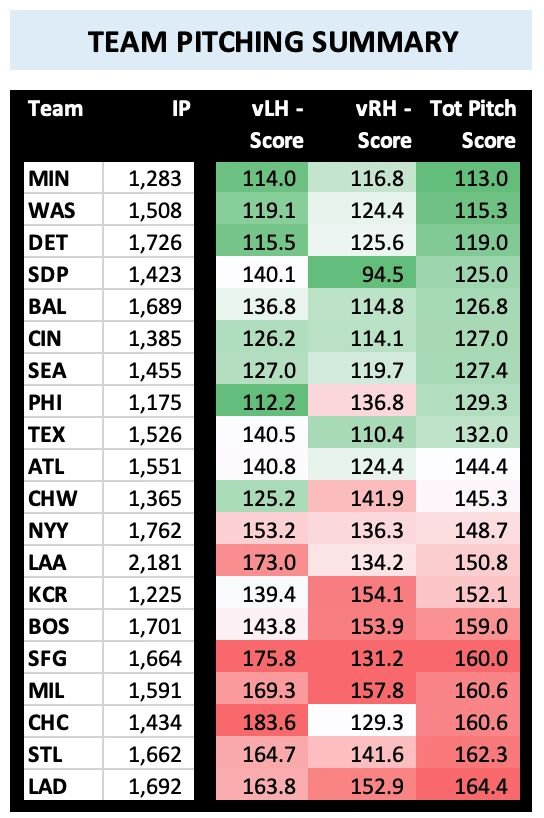
Team Pitching Summary -- Each pitchers' card chances are calculated to produce a "Pitch Score" versus lefties and righties. The Pitch Score versus lefties and the Pitch Score versus righties are multiplied by a factor to produce the Total Pitch Score (TPS). The multiplicative factor varies if the pitcher himself is a righty or a lefty. Scores are largely dependent on on-base and total bases allowed. A factor is used to convert a certain percentage of Deep Drives to home runs and the factor is based on the midpoint of a B and C power hitter in the pull-alley of a league-average park (this factor has run between 30% and 40%). Range and Error chances are multiplied by a league average and are not team-dependent. Positive adjustments are made to each sidedness Pitch Score for "jam", "jam+", "on" and "off" results and for "quality out" results (double plays and strikeouts). Ability to hold runners, pickoffs, and defense are not considered. The team Total Pitch Score is the average of the pitchers on its 40-man roster weighted by real-life innings pitched. A lower score is better. The green-white-red scaling is based on an equal distribution between the highest and lowest values and is not pegged to a curve.
Expected Wins (ExW) -- The team Total Hit Score and Total Pitch Score are used to determine ExW. The TPS is subtracted from the THS, producing a positive or negative number, this number is then plotted on a convex scale from 0 to 100 -- a negative result is given a value of 0 and a result exceeding 100 is given a value of 100. A value of 0 correlates to 27 ExW (a .300 winning percentage) and a value of 100 correlates to 60 ExW (a .667 winning percentage). The convexity of the scale softens the distribution. ExW is a point-in-time evaluation of a team's roster based on THS and TPS outcomes. The pre-season and post-trade deadline ExW values are pro-rated based on season proportions, with the pre-season outcome composing 63.3% of the total and the post-trade deadline outcome composing 36.7%. The "Actual + ExW" takes the team's actual record through 57 games and adds a pro-rated ExW based on their post-trade deadline roster.