Die Don't Lie: It's Time to Grouse About Unmet Expectations
It's that time of the season again. There are enough games in the books -- 30 for most teams -- that slow starts are on the verge of becoming bad seasons, and fast starts could turn into storybook endings.
The MMDBL season is 90 games long, but the 1/3rd mark is the first statistically valid stop on the journey. There are enough plate appearances, generally speaking, that a trend is a trend.

But is the trend your friend? For some, the answer is a resounding "yes." But not for others who will be looking to break the trend and reverse the curse when the season resumes this week.
A year ago we unveiled an evaluation methodology in a blog titled Hope Springs Eternal ... Until Expectations Aren't Met. We had tasked the MMDBL Advanced Analytics Department (MAAD) with a two-part analytical challenge focused on offensive output. The first part was to come up with a methodology to numerically quantify each team’s expectations for offensive performance. The second part was to evaluate how each team is doing in terms of meeting those expectations.
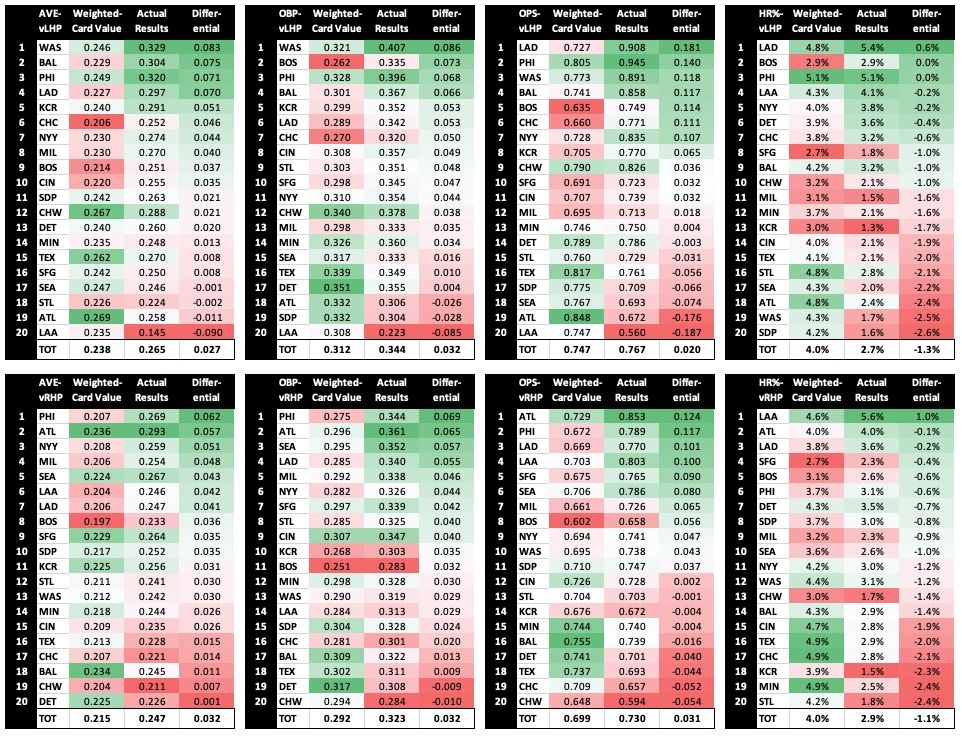
For this article, MAAD has refreshed its offensive expectations analysis focusing on the first 30 games of the 2024 season. The expectations are divided into two groups – hitting versus lefties and hitting versus righties. Within each group, we established benchmark expectations for batting average (AVE), on-base percentage (OBP), on-base plus slugging percentage (OPS) and the percentage of plate appearances resulting in homeruns. To establish each team’s expectations, we calculated the weighted-card value for each category. The weighted-card value is just that – the probability for the measured offensive result for each batter in each of the four (4) categories weighted according their percentage of a team’s aggregate MLB plate appearances for the 2023 season, which is the basis for the MMDBL's 2024 season. Those weighted values are then summed to produce a team's expected AVE, OBP, OPS and home run percentage versus lefties and versus righties, based solely on the composition of the team's hitter cards.
This approach has its shortcomings. For instance, it doesn’t account for actual player usage. For example, a player in the minors who is rarely used may have 550 plate appearances, and an often-used player may have 150 plate appearances, yet the player with more plate appearances will be more highly weighted in the analysis. It doesn’t take into account externalities that may impact outcomes. For example, weather and wind effects, the quality of the opposing pitchers, injuries and suspensions, and ballpark differences between where a hitter plays their home games in the MMDBL versus the MLB are either not considered or not controlled. Defense is also excluded, so a team that has played the majority of its games against really good defensive squads is more likely to have lost a few range hits and, as a result, more likely to underperform expectations. We should also note that this analysis looks only at hitter card chances and does not give any credit to Deep Drive chances or other positive offensive chances coming from pitcher's cards. Pitcher card results, however, are included in the actual 2024 season output analysis.
As a GM in this league, imagine that you're looking at your offensive cards and declaring, "this team should be hitting better!" Or perhaps you're just the opposite, "How is this team hitting like it is?" This is truly an exercise in exceptions -- met, unmet and gleefully exceeded.
iRSA and Offensive Output
A year ago, we were inspired to perform this analysis because it seemed like it was painfully difficult to score runs. We featured a blog titled It Sure is Hard to Score Runs These Days, Right? in which we statistically validated that the 2023 was not only on pace to record a low-mark in MMDBL homer output, but also that homer output was under-performing expectations. MAAD
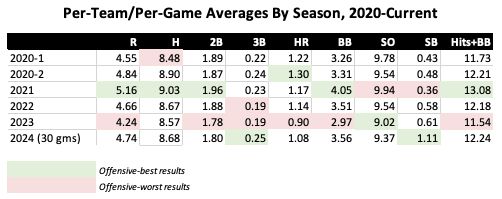
then translated that into a metric we call "implied Runs Scored Average (iRSA)" versus lefties and versus righties for all 20 teams and, cumulatively, for the league. iRSA basically looks at runs scored relative to total chances versus the pitching cohort (i.e., lefties or righties) and then recreates that statistical output over the cohort as if that pitcher handedness was the only type faced. The result is an amount of implied runs scored based on the team's offensive performance versus each handedness cohort. The 2023 analysis concluded that lefties were yielding an iRSA of 4.69, or 0.86 higher than the iRSA for righties of 3.83. The league average at the time was 4.26 runs per-team per-game (see table above).
MAAD has refreshed the iRSA analysis for the 2024 season. Offense is back in vogue again. For the 2024 season, lefties are yielding an iRSA of 5.07, or 0.61 higher than the iRSA for righties of 4.46, with the league average currently at 4.74 runs per-team per-game.) If the 4.74 average persists, 2024 will be the MMDBL's 3rd most offensive season behind 2021 (5.16 runs per-team per-game) and 2020 Season No. 2 (4.84). The 2023 season continued its trajectory and did, in fact, finish as the MMDBL's least offensive season.
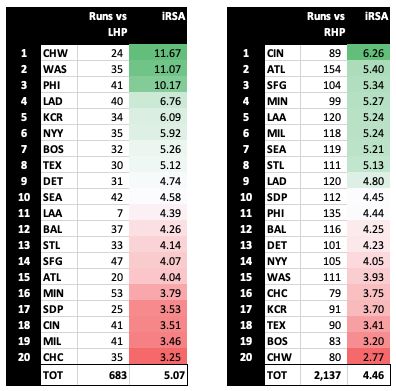
From an iRSA perspective, some teams are producing great results and others are not. For example, the tables below show iRSA, which is basically the calculated runs per-game, for each team -- one table shows results versus lefties and the other shows results versus righties. Against lefties, the White Sox, Nationals and Phillies are each scoring an average of more than 10 runs when facing lefties. Meanwhile, the Cubs, Brewers, Reds and Padres are each scoring less than 3.75 runs per game against lefties. There is substantially greater variance in results versus left-handed pitchers due to the smaller sample size (22% of plate appearances this season have been against lefties.)
Against righties, there is less volatility top-to-bottom, but there are some clear winners and losers. The Reds are averaging 6.26 runs per-game when facing only righties. At the bottom of the list is the White Sox with just 2.77 runs per-game versus righties.
Similar to last season, actual offensive output exceeds the offensive card expectation across AVE, OBP and OPS. This makes sense when you consider there is more offensive talent spread through MMDBL lineups 1-to-9 than in major-league lineups. This concentration of offensive talent overwhelms the concentration of pitching talent, resulting in MMDBL results being 10-15% more offensive in the batting average and on-base categories.
Pitchers have one matchup advantage and that is in home run suppression. GMs tend toward pitchers with fewer deep drives and the ability to steal home runs (less than 1.0 HR/9) and this is once again resulting in holding down home run percentage and, in turn, suppressing OPS. Home run percentage is roughly 30% lower than in the majors.
Another repeat finding -- MMDBL hitters, on balance, do better against left-handed pitching. Not only do their card chances suggest better results versus lefties, but MMDBL hitters are also outpacing their weighted-card value expectations against southpaws.
The Team Tables below take a look at how each team is performing relative to their weighted-card value at the 30-game mark. In presenting the tables, we show three (3) columns:
Weighted-Card Value -- This is the sum of card chances converted into traditional baseball slash line metrics, and we've added home run percentage to the group.
Actual Results -- These are the actual results of MMDBL league play, by team, for the first 30 games.
Differential -- This is the difference between Actual Results and Weighted-Card Value; it is literally Actual Results minus Weighted-Card Value.
The green-white-red shading represents a team's relative ranking within each column. The darker the green, the higher the expectations, the better the results and/or the bigger the positive differential. The darker the red, the lower the expectations, the worse the results, and/or the bigger the negative differential. Whiter shading reflects middle-of-the-pack expectations, performance and/or minimal differential. Each table is sorted best-to-worst based on Differential, highlighting which teams are over-performing and which are under-performing.
Rather than providing analysis on the Team Tables, we'll just put them here and let you enjoy. But let’s first discuss our feelings (we have this "feelings" discussion each time!) Those of you who see red for your team in the Differential columns will likely feel some confirmation that Lady Luck has not been with you. Conversely, those of you with a lot of green in the Differential columns may now have some numeric proof that the horseshoe exists and is on your side (or however the saying goes.)
Some of you may be surprised by the “expectations” as established in the Weighted-Card Value columns. And some of you may dismiss those expectations knowing full well that you set your lineups to maximize outcomes and that the weighted-card value methodology doesn’t capture your player usage patterns. Perhaps those usage patterns fully explain the differential.
These are all fair feelings to have, but hopefully this analytical exercise generates some thought, insights and perhaps discussion. We considered additional enhancements to the analysis but those changes are currently out of scope for the MMDBL’s under-staffed and under-funded Advanced Analytics Department (we call them MAAD for a reason!) We'll pursue budget approval again for 2025.