
MAAD Gab: Nationals to best Giants in the 2026 World Series
It’s that time of the year again, the time when we ask the MMDBL Advanced Analytics Department (MAAD) to run its models and churn out the forecast for the new season.
With the draft concluded, the trading front quiet, rosters seemingly set, and Opening Day just hours away (February 11), the MAAD data scientists have the data needed to run the analytical models and produce 3 key metrics – Run Production Score, Run Prevention Score, and Expected Wins (ExW) – for each team.

We’ll explain MAAD’s analytical process but first comes the disclaimer: This forecast is for recreational purposes only. While MAAD has been directionally correct in predicting team regular-season win totals over the MMDBL’s first 7 seasons, there have been some noteworthy outliers.
MAAD Results: The Good and The Bad
Last year, MAAD predicted the Twins would win 58 games and the Giants, 52, and that the Twins would beat the Giants in the World Series. The Twins won 52 and the Giants, 48, and both made playoff runs. But it was the Dodgers beating the Rangers for their first World Series title. The Dodgers won 51 games – exactly as MAAD projected – and Texas outperformed (53 wins to 49 ExW).
In the 2024 season, the Twins were again projected to win the World Series, this time over Detroit, with the MAAD model predicting 57 wins for Minnesota and 56 for Detroit. Both teams finished with 54 wins as it was Texas (60 wins versus 54 ExW) and Baltimore (59 versus 53 ExW) leading the MMDBL in wins, and it was Baltimore besting Seattle in the World Series. The Mariners were projected to win 45, but they acquired Mookie Betts and remade their bullpen enroute to winning 50 and entering the playoffs as one of the league’s hottest teams. The MAAD scientists re-ran the model at the trade deadline and, with Betts and the other acquisitions in the fold, it forecast the Mariners as a 55-win team over 90 games and estimated their final win total would be 49, which was just one shy of their actual total.
In 2023, the Philadelphia Phillies won the World Series over the Chicago White Sox. Both teams were well-regarded entering the season, however, the Phillies each season have outperformed the MAAD model ExW projection. The model developers will tell you point blank that the model cannot project how players will be used – it merely projects a team’s ability to produce and prevent runs based on each player’s proportion of playing time within the context of the 40-man roster. In the case of the Phillies, it routinely misses, especially when it comes to estimating run prevention. It is well-chronicled the Phillies embrace “The Opener” concept and Bill James’ theory that pitcher effectiveness is maximized if hitters see them only once a game. This usage pattern foils the MAAD model.
Another usage pattern that the model struggles to estimate is platoons and the availability of quality late-inning bench bats. If a game is tied entering the 7th inning, forget the model. From this point forward it comes down to pitcher-hitter matchups, the ability to gain a base, and the ability to steal outs.
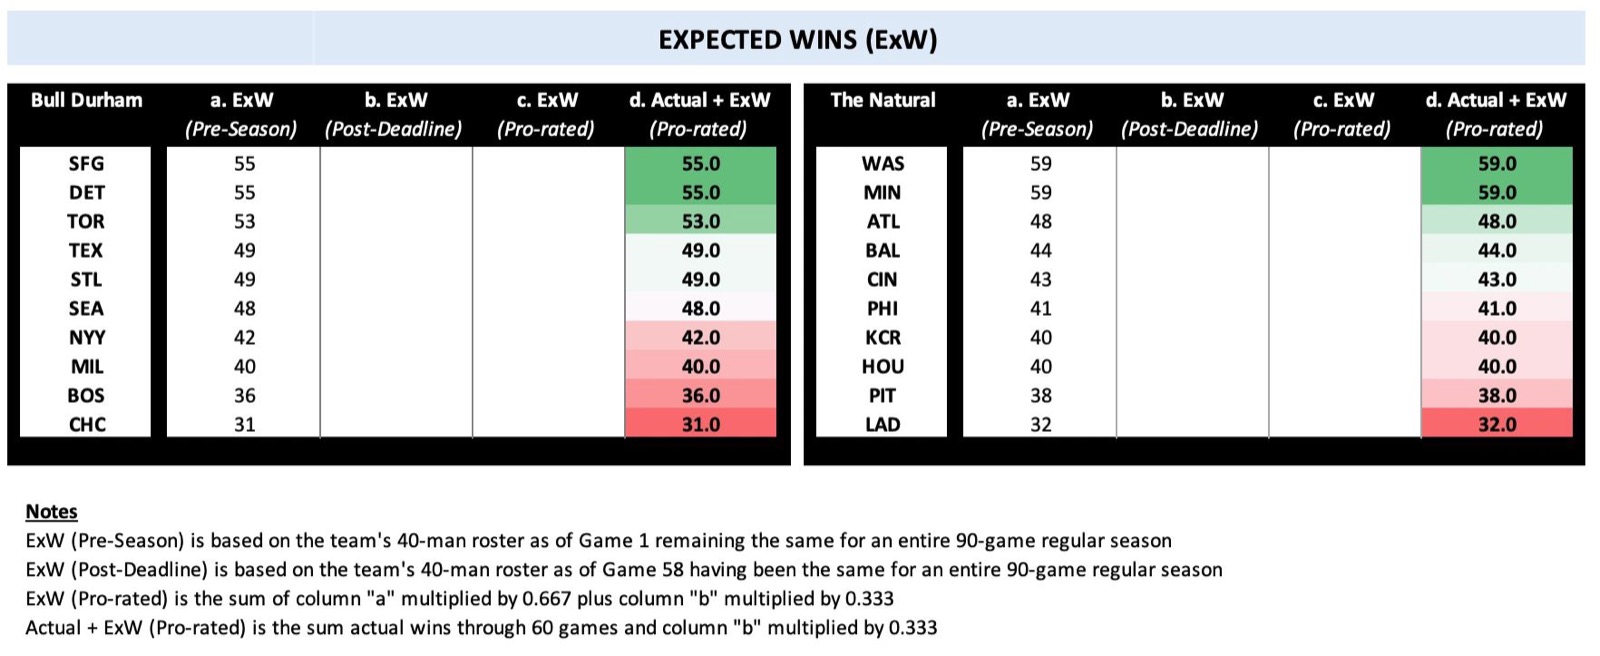
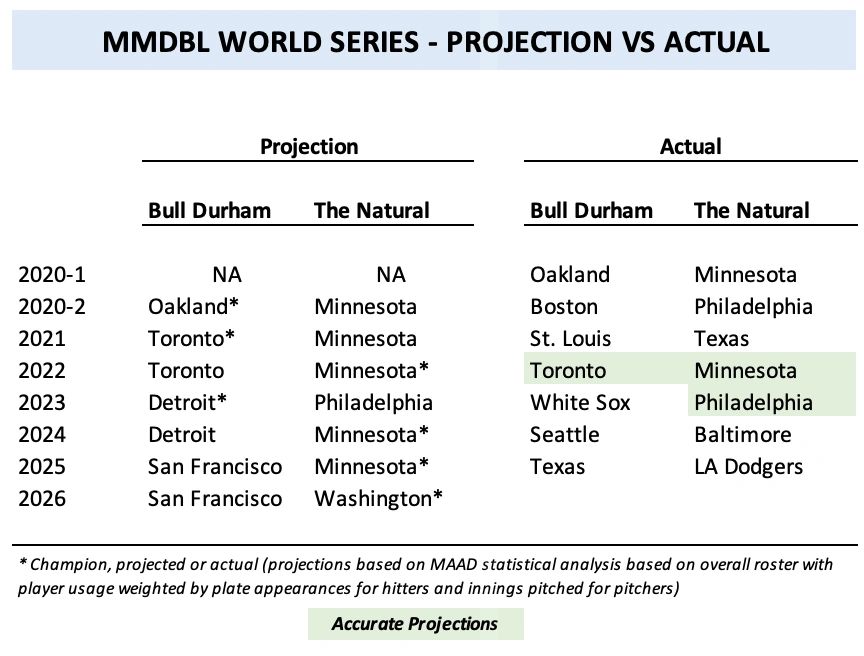
With all its flaws and limitations, the MAAD model is a data-driven exercise in estimating team success. For 2026, it projects San Francisco will win the Bull Durham, Washington will win the Natural, and it will be the Nationals who win their first-ever World Series in the MMDBL’s 8th season. According to MAAD, the Bull Durham division will feature 6 teams with 48 wins or more – San Francisco, Detroit, Toronto, Texas, St. Louis, and Seattle – and 4 teams that will average 37 wins, which is a fairly bright divide. In the Natural division, the model predicts the playoff teams will be Washington, Minnesota, Atlanta, Baltimore, Cincinnati, and Philadelphia. However, 5 wins are expected to separate the 5th through 9th teams, suggesting a more hotly contested playoff race than the Bull Durham.
Explaining the MAAD Model
For the uninitiated, and for those who would like to be re-initiated, we’ll explain the core metrics in the MAAD analysis, as well as some new additions for this year.
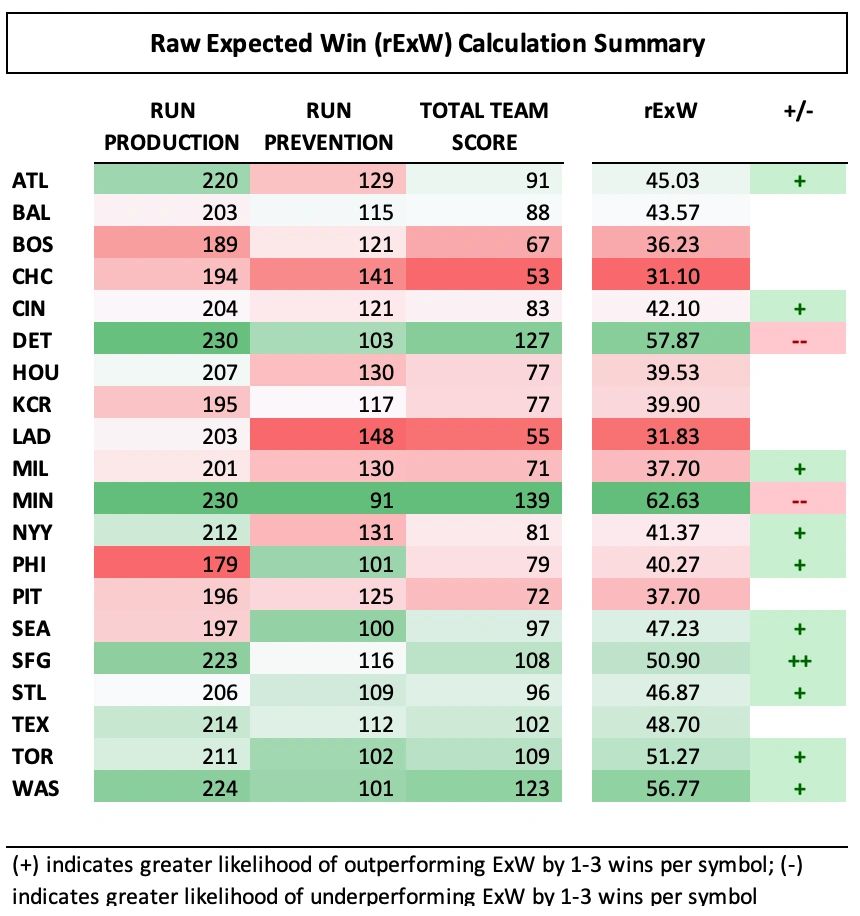
Expected Wins (ExW) – The goal of the whole analytical effort is to derive an expected number of wins for each team based on the weighted expected run production and run prevention outcomes of each of a team’s 40 players, based on their current card values. ExW represents the expected win total a team will achieve. rExW is the “Raw Expected Win” total for each team – a purely data-informed metric – and out-of-model +/- adjustments are made to reflect factors not adequately reflected in the data to arrive at each team’s ExW. rExW is a simple math equation: Run Production Score – Run Prevention Score = Net Differential, with the Net Differential referenced against a bell-curved distribution of probable wins from 0 to 90, with 96.5% of the distribution falling between 30 and 62 wins.
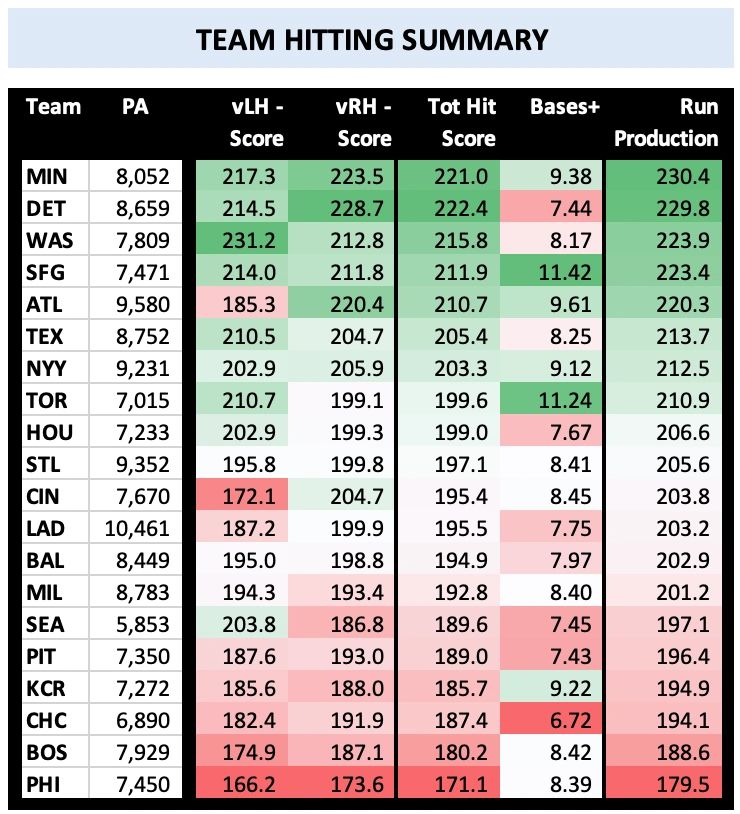
Run Production Score – This estimates a team’s ability to score runs, with a higher score being better. Generally, a value of 215 or greater is considered a top offense. The Run Production Score has 2 components – the Total Hit Score and Bases+. The Total Hit Score is the weighted result of each team’s vLHP Score and vRHP Score; and Bases+ is a relative measure of additional bases earned by a team’s ability to steal, bunt, hit and run, and advance on hits and flyouts. Bases+ is a new component of the model this year.
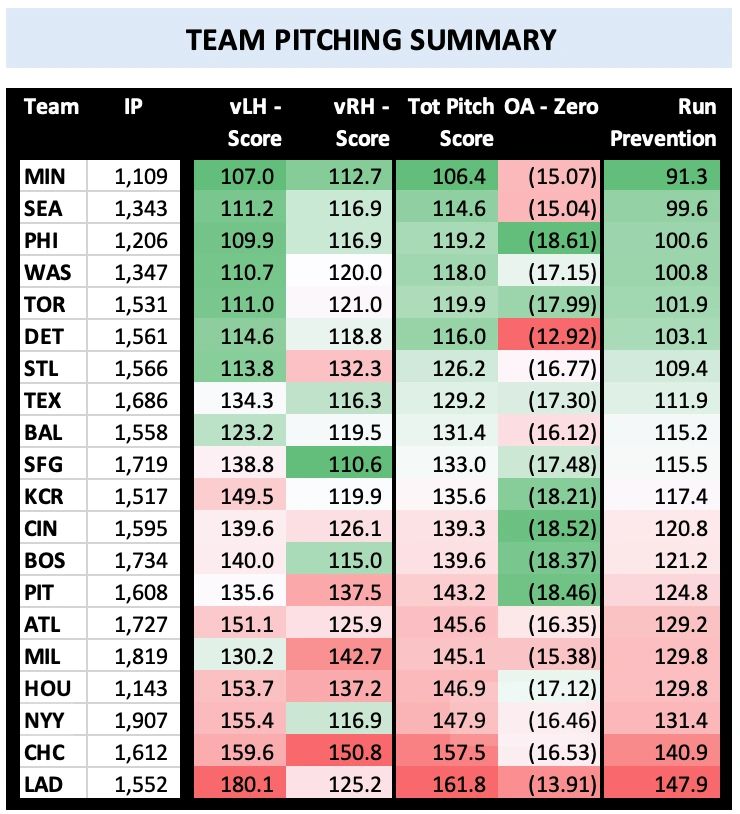
Run Prevention Score – This estimates a team’s ability to prevent runs, with a lower score being better. Generally, a value of 110 or less is considered a top defense. The Run Prevention Score has 2 components – the Total Pitch Score and OA-Zero. The Total Pitch Score is the weighted result of each team’s vLHH Score and vRHH Score; and OA-Zero (Outs Above Zero) is a relative measure of additional outs earned above a league-worst defensive player through the range, error and arm ratings of each position player on the roster. OA-Zero is a new component of the model this year.
Out-of-Model Adjustments – An out-of-model adjustment is exactly what it sounds like – a man-made increase or decrease in ExW that attempts to take into account factors the model cannot. This is a feature introduced last year. Adjustments are made for player limitations that are likely to come into play, key injury probabilities (and the ability to address injuries and remain competitive), and matchup advantages/disadvantages likely to cause over/under performance.
A Healthy Dose of Bill James Pythagorean Theorem
MAAD’s analytical approach is rooted in Bill James’ work but modified to include more recent enhancements. There’s a big difference – Bill James attempted to forecast how players and teams would perform in the future. MAAD knows how players performed because each player has a card with known probabilities. As a result, MAAD is taking those known probabilities for each player and estimating how a team will perform in a context-neutral situation. There are no adjustments for ballpark, weather, schedule strength, or managerial style, thus it is a context-neutral evaluation. For reference, the MAAD approach is most similar to Fangraphs’ BaseRuns formula.
Enough with predictions. It’s time to make history and fulfill expectations or defy the odds. It’s time to play ball.